
S&P 500 Erases Post Election Gains
Global Stock Market Returns
· S&P 500: -1.3%
· Dow 30: -1.16%
· NASDAQ: -3.91%
· Russel 2000: -5.35%
· MSCI EAFE: 1.95%
· MSCI Emerging Markets: 0.5%
Bond Market Performance
· The 3 Month US Treasury Rate remained Steady at 4.32%
· The 2 Year US Treasury Rate declined 23bps to 3.99%
· The 10 Year US Treasury Rate declined 34bps to 4.24%
Major Headlines
· Trade Tensions: Ongoing trade negotiations between the U.S. and China, with new tariffs announced but delayed pending further talks. [1]
· Federal Reserve: The Fed maintained interest rates at 4.25%-4.50%, emphasizing the need to address inflationary pressures [2]
Economic Data
· Job Growth: The US economy added 151,000 jobs in February, with the unemployment rate steady at 3.91% [3]
· Inflation: The Consumer Price Index (CPI) rose by 0.5% month-over-month [4]
· Economic Growth: Mixed signals with strong consumer spending but concerns about potential stagflation. [5]
Investor Sentiment
· Shift in Preferences: Confidence in “US Exceptionalism” weakened, with investors favoring European stocks over US Equities. [6]
· Caution on Recession: Concerns about a potential global recession and ongoing geopolitical tensions tempered investor optimism. [7]
Citations
1. https://www.nasdaq.com/articles/february-2025-review-and-outlook
2. https://www.federalreserve.gov/monetarypolicy/beigebook202502-summary.htm
3. https://edition.cnn.com/business/live-news/us-jobs-report-february-2025
4. https://www.fanniemae.com/research-and-insights/forecast/economic-developments-february-2025
6. https://www.zacks.com/stock/news/2419012/investor-sentiment-at-15-year-high-etfs-in-focus
7. https://www.lpl.com/research/blog/investor-sentiment-hits-extremely-bearish-levels.html
Commentary:
For the last few months, we have been writing about our expectations for heightened market volatility in 2025. Last month specifically, we highlighted tariff concerns and wrote about how we planned to scale back risk in specific areas of the markets moving forward. We did so by selling IJT (Small Cap Growth), PSCI (Small Cap Industrials), and UUP (US Dollar) in our portfolios, which returned -5.28%, -6.46%, and -0.41%, respectively in the month of February. We have also been stressing that a globally diversified portfolio is preferred a domestic-focused one as we believe diversifying across various international markets can help mitigate risks associated with any single economy. In February we saw the positive effects that Global Diversification can have on portfolios with the MSCI EAFE index up 1.95%, while the S&P 500 had a negative return of -1.3%. Over the past several years, this global focus has been a bit of a drag on our portfolios when compared to US only markets. However, it is showing up when domestic markets are pulling back.
We do expect some of these same trends to continue as we move through the first half of 2025 as both growth concerns in the US and trade uncertainty remain prominent. The reinstatement of tariffs on global still and aluminum imports, along with the introduction of reciprocal tariffs, has further fueled market uncertainty. Thus, we have seen an increasing number of executives express concerns over potential economic repercussions in quarterly earnings reports and have seen stock prices reflect those concerns.
Additionally, when we look back in 2023, some of your recall many professionals were talking about a pull back as the economics did not support the continued growth of the stock markets, including ourselves. However, as we wrote about in late 2023 and early 2024, we, nor others in the industry accounted for the increase in government spending. If DOGE does what it reports that it will do, this reduction in government spending also could lead to a pull back or at least some choppy waters ahead.
Conclusion:
Due to these factors, we believe volatility may be here to stay in 2025 or at least over the next 4-8 months. Below is a chart from Bloomberg Finance showing the average price move of S&P 500 by day of the week, comparing 2025 to the historical average going back to 1928.
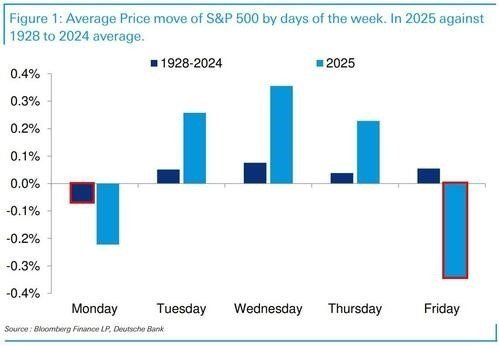
As you can clearly see 2025 has been volatile and those who have not had diversification within their portfolio have felt that volatility more so than others. As we move forward, we continue to favor value stocks over growth stocks in the equity market as value stocks tend to out preform growth over long periods of time and often times have lower volatility . As a reminder, value stocks typically have lower P/E ratios and higher dividend yields, have historically offered a more stable investment during uncertain times. The chart below compares the Annualized Standard Deviation of Monthly Returns of the Russel Value and Russel Growth Indexes. As a reminder, higher standard deviation indicates more volatility, while lower standard deviation signifies steadier returns.

If you’d like to learn more about Growth vs Value, please click on the links below to view our previous articles that go in depth on the topic.
Growth vs. Value: Is It Time for Value to Take the Lead? - Part 1 — SBC Investment Management
Growth vs. Value: Is It Time for Value to Take the Lead? - Part 2 — SBC Investment Management
We will continue to be shorter on the yield curve as well on the fixed income side as we interest rates are showing signs of uncertainty. We’ll continue to advocate for global diversification in the portfolio over being strictly domestic as well as having crisis alpha allocations (Satellite 5) that are uncorrelated with the general market as a whole. Remembering this is a marathon not a sprint will help keep things in perspective.
Model Performance Update
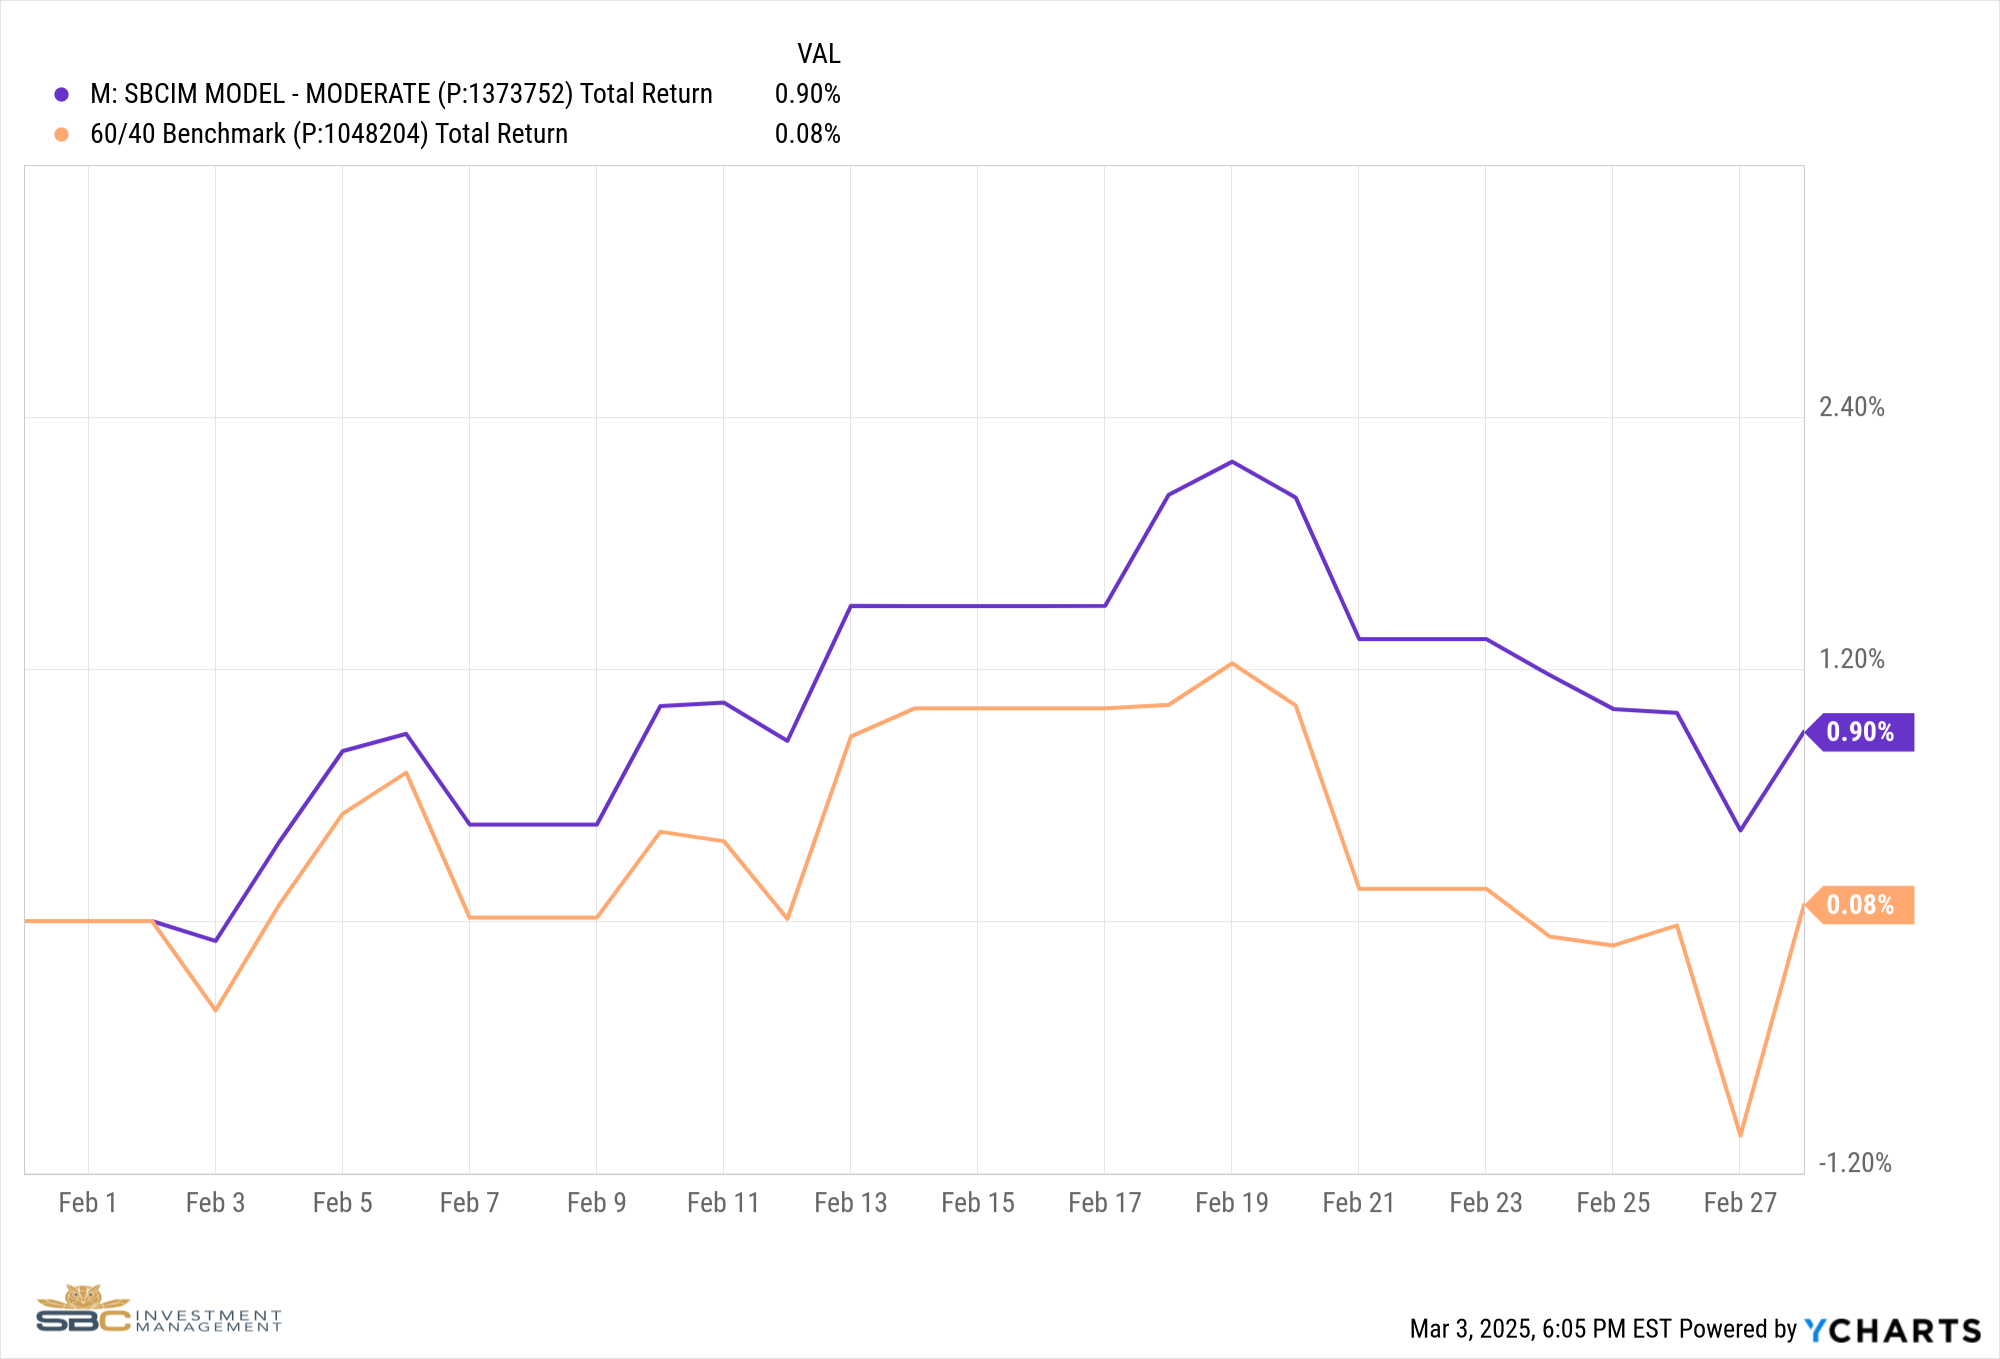
Our Moderate Model Portfolio returned 0.9% during the month of February and has returned 3.72% YTD.
Changes to the model portfolio in February
· 2/4/2025 – Removed IJT (Small Cap Growth) and PSCI (Small Cap Industrials) from Satellite 1
· 2/4/2025 – Added XLF (Financials) to Satellite 1
· 2/4/2025 – Removed UUP (US Dollar) and replaced it with a cash alternative in Satellite 3
February Performance with Benchmark
YTD Performance with Benchmark

If you were to have any questions regarding the above, please reach out to us to set up a one-to-one meeting to review your situation.
Sincerely,
Bryant Andrus, MSF, CFP®
President
SBC Investment Management
P: (602) 641-5996
M: (319) 520-2033
E: bandrus@sbcinvestmentmanagement.com
DISCLAIMERS
SBC Investment Management’s Monthly and Quarterly Market Summary and Outlook is intended to communicate current economic and capital market information along with the informed perspectives of our investment professionals. All expressions of opinion are subject to change. Past performance may not be indicative of future results. There is no assurance that any of the trends discussed will continue, or that any of the forecasts will occur.
You should not construe any information in this publication as investment, financial, or any other professional advice. Nothing contained in this publication constitutes a recommendation, endorsement, or an offer to buy or sell any securities or other financial instruments. You should conduct your own research or speak to your investment advisor before investing.
SBC Investment Management prepares this material as a resource for its clients. This content is for informational purposes only and does not address the circumstances of any particular individual or entity. You may contact us to discuss the content of this publication within the context of your own financial situation.
Past performance may not be indicative of future results. Different types of investments involve varying degrees of risk. There can be no assurance that the future performance of any specific investment, investment strategy (including the investments and/or investment strategies recommended or undertaken by SBC Investment Management, LLC), or any non-investment related content, referred to directly or indirectly in this piece will be profitable, equal any corresponding indicated historical performance level(s), or prove successful. Due to various factors, including changing market conditions and/or applicable laws, the content may no longer be reflective of current opinions or positions. Moreover, you should not assume that any discussion or information contained in this piece serves as the receipt of, or as a substitute for, personalized investment advice from SBC Investment Management, LLC. Investment performance results published herein do not include investment advisory fees paid, or any other related account expenses. Performance results compiled solely by SBC Investment Management, LLC, have not been independently verified, and do not reflect the impact of taxes on non-qualified accounts.
Historical performance results for investment indices (provided for general comparison purposes only), strategies, models and/or indicators generally do not reflect the deduction of an investment management fee, nor the impact of taxes, the incurrence of which would have the effect of decreasing historical performance results. It should not be assumed that your account holdings correspond directly to any comparative indices.
Our past recommendations and model portfolio results are not a guarantee of future results. Using any graph, chart, formula, or other device to assist in deciding which securities to trade or when to trade them presents many difficulties and their effectiveness has significant limitations, including that prior patterns may not repeat themselves continuously or on any particular occasion. In addition, market participants using such devices can impact the market in a way that changes the effectiveness of such device.
Hypothetical performance results shown in this report and on sbcinvestmentmanagement.com are backtested and do not represent the performance of any account managed by SBC Investment Management, LLC. They were achieved by means of the retroactive application of each of the previously referenced models, certain aspects of which may have been designed with the benefit of hindsight.
The hypothetical backtested performance does not represent the results of actual trading using client assets nor decision-making during the period and does not and is not intended to indicate the past performance or future performance of any account or investment strategy managed by SBC Investment Management, LLC. If actual accounts had been managed throughout the period, ongoing research might have resulted in changes to the strategy, which might have altered returns. The performance of any account or investment strategy managed by SBC Investment Management, LLC will differ from the hypothetical backtested performance results for each factor shown herein for a number of reasons, including without limitation the following:
Although SBC Investment Management, LLC may consider from time to time one or more of the factors noted herein in managing any account, it may not consider all or any of such factors. SBC Investment Management, LLC may (and will) from time to time consider factors in addition to those noted herein in managing any account.
SBC Investment Management, LLC may rebalance an account more frequently or less frequently than annually and at times other than presented herein.
The hypothetical backtested performance results for each strategy include estimated values for transaction costs of buying and selling securities, which may not be accurate. Investment management fees, custody and other costs, and taxes – all of which would be incurred by an investor in any account managed by SBC Investment Management, LLC are not included in performance results. If such costs and fees were reflected, the hypothetical backtested performance results would be lower.
The hypothetical performance does not reflect the reinvestment of dividends and distributions therefrom, interest, capital gains and withholding taxes.
Accounts managed by SBC Investment Management, LLC are subject to additions and redemptions of assets under management, which may positively or negatively affect performance depending generally upon the timing of such events in relation to the market’s direction.
Simulated returns may be dependent on the market and economic conditions that existed during the period. Future market or economic conditions can adversely affect the returns.
SBC Investment Management, LLC is neither a law firm nor a certified public accounting firm. No portion of our website, our newsletter content, or any other correspondence from us should be construed as legal or accounting advice.