
Growth vs. Value: Is It Time for Value to Take the Lead? - Part 2

In Part 1, we looked at the 40-year history of Growth vs. Value as measured by the Russell 3000 Growth and Value indexes. We identified four alternating secular (i.e., long-term) cycles between the two styles with the current Growth cycle being the longest. Before we can determine if it is time for Value to take the lead, we need to consider size.
The Russell 3000 is comprised of large-cap and small-cap stocks. The Russell 1000 Index contains the top 1,000 stocks by market capitalization, and the Russell 2000 Index contains the next 2,000 stocks. The Russell 1000 accounts for more than 90% of the weight of the Russell 3000, which tells us that small-cap stocks make up a small percentage of the overall market. Since large and small-cap stocks have their own secular cycles within the overall stock market, our analysis of Growth and Value would not be complete without viewing these styles within the large-cap and small-cap spaces.
Since large-cap stocks comprise such a large portion of the overall stock market, it stands to reason that the Russell 1000 and Russell 3000 indexes would behave similarly. As expected, the next four graphs demonstrate that the Russell 1000 and Russell 3000 track each other closely. We also observe that the secular Growth and Value cycles for the Russell 1000 span the exact same time periods as they did for the Russell 3000.
For the first period from 11/30/81 through 9/30/89, the Large-Cap Value outperformed. The annualized total return for the Russell 1000 Value Index was 19.91%, versus an annualized total return of 16.06% for the Russell 1000 Growth.
Russell 1000 – Cumulative Total Returns, 11/30/1981 through 9/30/1989

Source: Factset, Yahoo Finance
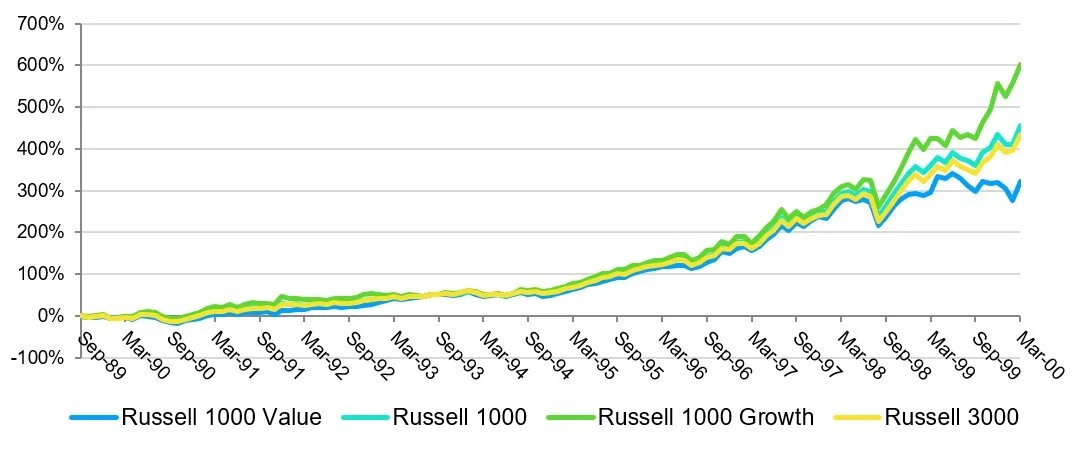
Large-Cap Growth outperformed during the next period from 9/30/89 through 3/31/00. The annualized total return for the Russell 1000 Growth Index was 20.23%. The annualized total return of the Russell 1000 Value was 14.57%.
Russell 1000 – Cumulative Total Returns, 9/30/1989 through 3/31/2000
Source: Factset, Yahoo Finance
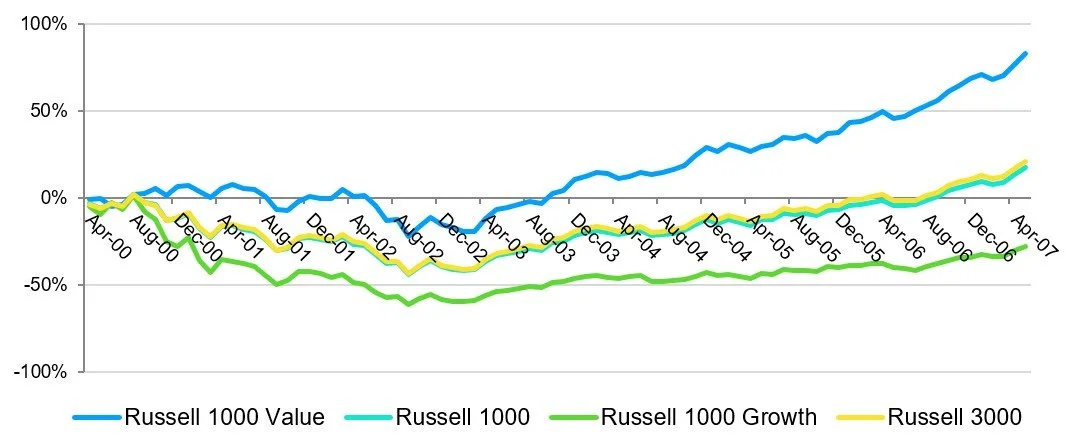
Large-Cap Value outperformed from 3/31/00 through 5/31/07. The annualized total return for the Russell 1000 Value Index was 8.81%. The annualized total return of the Russell 1000 Growth was -4.44%.
Russell 1000 – Cumulative Total Returns, 3/31/2000 through 5/31/2007
Source: Factset, Yahoo Finance
Finally, Large-Cap Growth has outperformed since the Great Financial Crisis. From 5/31/2007 through 11/31/2021, the annualized total return for the Russell 1000 Growth Index has been 13.33%, and the annualized total return of the Russell 1000 Value has been 6.70%.
Russell 1000 – Cumulative Total Returns, 5/31/2007 through 11/30/2021

Source: Factset, Yahoo Finance
What about the small-cap stocks? Given that Large-Cap and Small-Cap have their own secular trends, it is likely that small-cap growth and value stocks may behave differently than large-cap growth and value stocks over time.
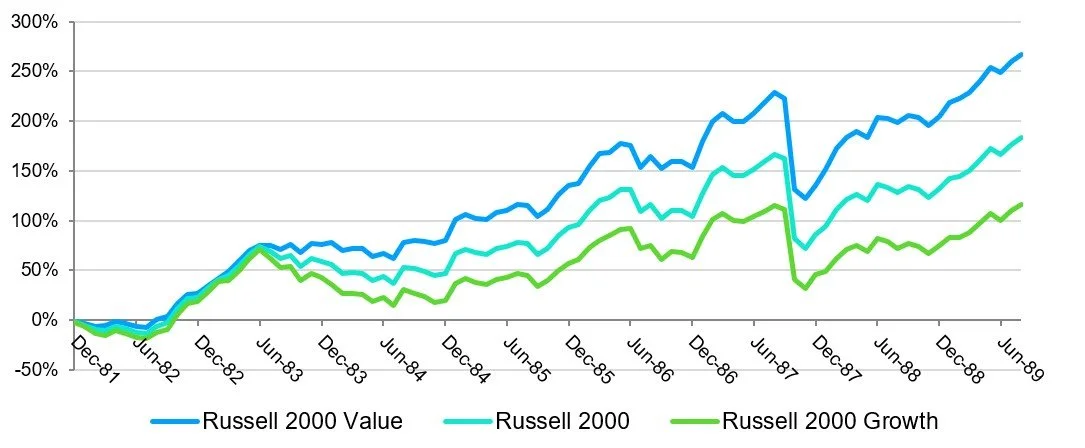
The graph below shows that Small-Cap Value consistently remained ahead of Small-Cap Growth for most of the 1980s. For the 94-month period from 11/30/81 through 9/30/89, the annualized total return for the Russell 2000 Value Index was 18.28%, and the annualized total return of the Russell 2000 Growth was 10.45%.
Russell 2000 – Cumulative Total Returns, 11/30/1981 through 9/30/1989
Source: Factset, Yahoo Finance
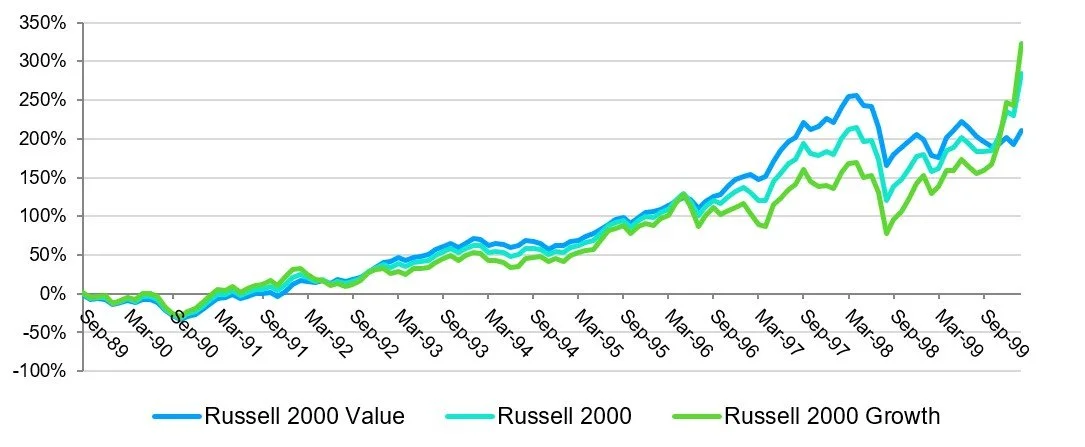
Small-cap stocks deviated from their large-cap counterparts in the 1990s. We see in the graph below there was no secular Growth or Value trend in the Russell 2000. Small-cap stocks vacillated between Growth and Value in short-term cyclical trends lasting anywhere from 18 to 30 months.
For the 125-month period from 9/30/89 through 2/28/00, the annualized total return for the Russell 2000 Growth Index was 14.72%. The annualized total return of the Russell 2000 Value was 11.42%. While Small-Cap Growth outperformed overall, it was not until the last 18 months that it significantly pulled ahead. From 8/31/98 through 2/28/00, the total return of the Russell 2000 Growth was 138%. This was 8 times the return of the Russell 2000 Value Index over the same 18-month period.
Russell 2000 – Cumulative Total Returns, 9/30/1989 through 2/28/2000
Source: Factset, Yahoo Finance
Given the spectacular returns of Small-Cap Growth, it is no wonder many small-cap investors clung to the asset class well into the Dotcom Crash. For those sticking with Small-Cap Value, their patience and perseverance through the Tech Bubble were rewarded. For the 84-month period from 2/28/00 through 2/28/07, the annualized total return for the Russell 2000 Value Index was 16.12%, versus a -2.81% annualized total return for the Russell 2000 Growth.
Russell 2000 – Cumulative Total Returns, 2/28/2000 through 2/28/2007

Source: Factset, Yahoo Finance
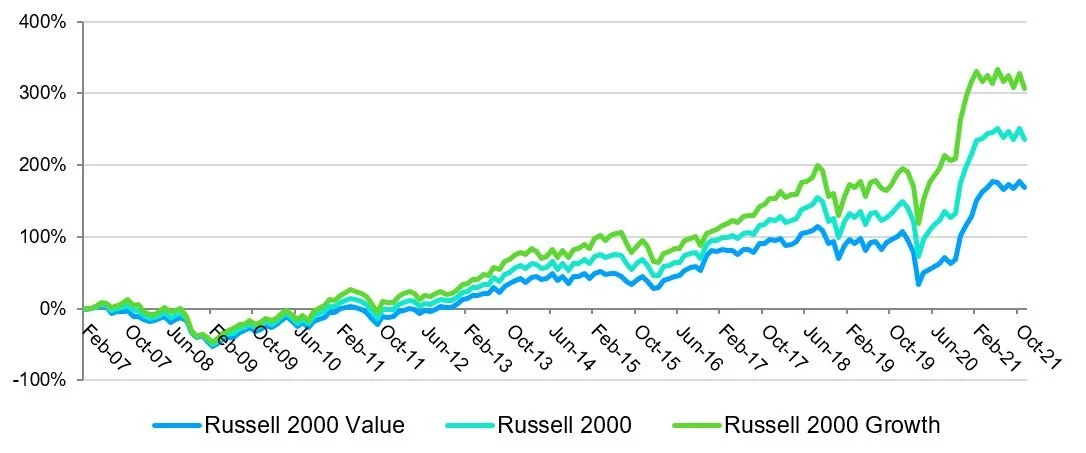
Whether, or not, investors are staunch supporters of Small-Cap Value and the work of Fama-French, we can all agree that Small-Cap Growth has outperformed Small-Cap Value for almost 15 years since the Great Financial Crisis. Since 2/28/07, the annualized total return for the Russell 2000 Growth Index has been 9.92%. The annualized total return of the Russell 2000 Value has been 6.88%.
Russell 2000 – Cumulative Total Returns, 2/28/2007 through 11/30/2021
Source: Factset, Yahoo Finance
However, when we look closely at the above graph, we see that the Russell 2000 Growth has broken down in the past year relative to the Russell 2000 Value Index. The graph below shows that the Russell 2000 Value Index is up 64.36% versus 32.69% for the Russell 2000 Growth Index for the past 14 months.
Russell 2000 – Cumulative Total Returns, 9/30/2020 through 11/30/2021

Source: Factset, Yahoo Finance
This is the opposite of what we see with large-cap stocks. Over the same 14-month period, the Russell 1000 Growth is up 39.19% versus 36.87% for the Russell 1000 Value.
In following the stock market for over 20 years, we have noticed that small-cap stocks are often first movers. In our analysis, we see that Small-Cap Growth peaked in February 2000—one month ahead of Large-Cap Growth—heading into the Dotcom crash. At the start of the GFC, Small-Cap Value peaked in February 2007—three months before Large-Cap Value. If small-cap stocks are front running large-cap stocks again, then it may be time to make the shift to Value.
While we advocate building positions in Small-Cap Value, we have not yet given up on Large-Cap Growth. Over the past 40 years, the Russell 1000 Growth Index is the best performer posting annualized total returns of 12.17%. The Russell 2000 Value Index is the runner-up with annualized total returns of 11.79%.
At this time, we think an overweight to Small-Cap Value with a 50/50 Large-Cap Growth and Value split is prudent. As long as large-cap growth and value stocks continue to move in tandem, rebalancing from Growth to Value can occur gradually. We will be on the lookout for an event that accelerates the transition.
DISCLOSURES
All expressions of opinion reflect the judgment of the author and are subject to change. Past performance may not be indicative of future results. There is no assurance that any of the trends discussed will continue, or that any of the forecasts will occur.
You should not construe any information in this publication as investment, financial, or any other professional advice. Nothing contained in this publication constitutes a recommendation, endorsement, or an offer to buy or sell any securities or other financial instruments. You should conduct your own research or speak to your investment advisor before investing.
SBC Investment Management prepares this material as a resource for its clients. This content is for informational purposes only and does not address the circumstances of any particular individual or entity. You may contact us to discuss the content of this publication within the context of your own financial situation.