
Protecting the Downside
Commentary:
If you are a client of ours, or have been keeping up with our articles, you'll know that one of our key principles is that we are willing to sacrifice some potential gains to safeguard against losses that occur during risk-off events.
As money managers, we will not beat the market year in and year out. In fact, only 11% of active managers do beat the market each year, and an even lesser number do it consistently over long periods. On average, the stock market has a positive annual return 3 out of every 4 years. We believe that as money managers how well we manage risk during the remaining 1 out of 4 years that markets are negative is an effective measurement of a money manager.
Our Core-Satellite approach offers various methods for managing risk in our portfolios, which is the primary goal of having a strategy such as this. In this article, I want to specifically highlight Satellite 5: managed futures. Managed futures are often overlooked and rarely found in the portfolios of our prospective clients. These strategies are designed to have a low correlation with equities and provide support during risk-off events, which is why we believe they are a crucial component of any portfolio.
We were fortunate to receive hypothetical back-tested data from the fund managers of CTA, allowing us to demonstrate the benefits of including managed futures in an investment portfolio. The following charts compare a 60/40 Benchmark Portfolio with that same 60/40 Portfolio that includes a 10% allocation to managed futures during previous periods where the financial markets saw significant distress.
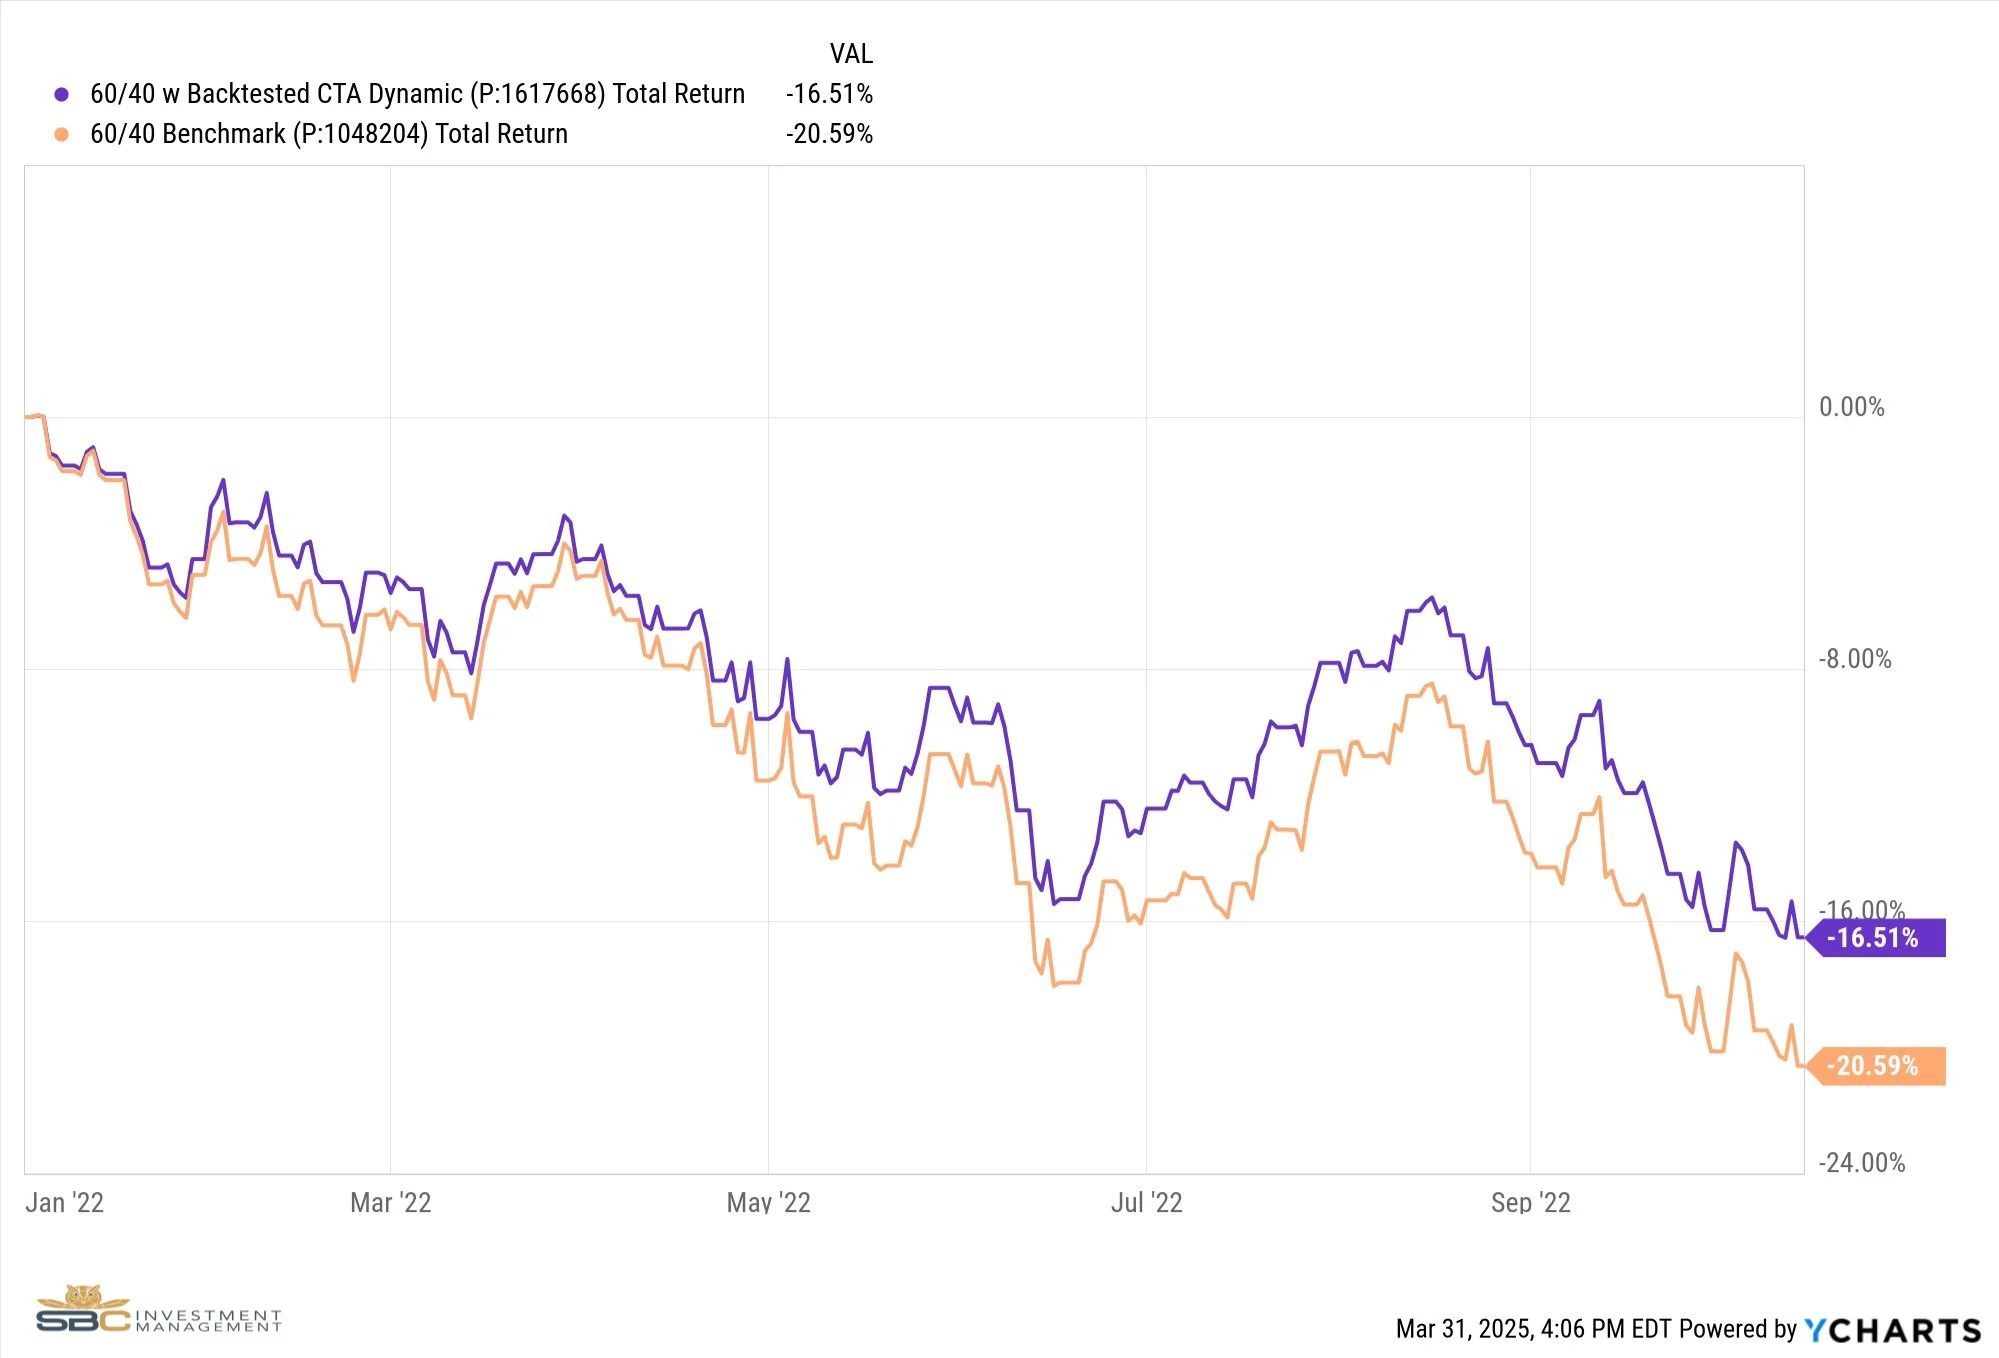
2022 Inflation Drawdown Period Returns

Great Financial Crisis Period Returns

Dot-Com Crash Period Returns
As you can see, during historical periods of significant financial market distress, such as the Dot-Com Bubble and the Great Financial Crisis, and the most recent 2022 Inflation Drawdown Period, managed futures would have greatly mitigated portfolio losses. While a 9%, 5%, or 4% difference in returns during these events may not seem substantial, the power of compound investment reveals how valuable this protection has been over the long term.

The same 60/40 portfolio that included a 10% position in managed futures would have generated a return of 540.5% going back to the year 2000 compared to the portfolio without managed futures, which returned 383.1% over that same period.
Conclusion:
At the end of the Q1 in 2025, the S&P 500 is down -4.27% Year to Date and down -8.51% from previous all-time highs set in February. While a 10% correction in the markets is normal and expected in any given year, the impact that tariffs will have on the economy remains uncertain, and the markets are actively trying to price in this uncertainty. We do believe that further market declines are possible given the current economic landscape. However, our proactive approach to risk management through our satellite process positions us well to handle these challenges. Each satellite plays a unique role in our overall risk management strategy, ensuring we are well prepared to respond as market conditions change. When signals and/or trends change, we may adjust our satellites to reflect new information; this is The Art of Investing. However, our Core will not shift, or change based on short- or medium-term trends; this is The Science of Investing.
For now, we remain cautious but not bearish. Slowing GDP growth is different from Negative GDP growth. It is likely that we see US GDP slowing in the first half of 2025 followed by a re-acceleration in the back half of the year. We have generated a fair amount of cash within our portfolios on the recent bounce in equities and are prepared to deploy that cash when and where our signaling process tells us to. This process has helped us mitigate the downside risk thus far in 2025, as shown by our risk adjusted performance Year To Date. We believe that by managing the downside risk effectively, together with global diversification, this can help to provide our clients with peace of mind, knowing that their investments are being managed with a focus on their short and long term goals, unique to each of their families.
If you want to keep up with the changes we are making each month, you can find them below in the back half of each newsletter.
Market Performance in the month of March
· S&P 500: -5.63%
· NASDAQ: -8.14%
· MSCI ACWI EX USA: -0.14%
· Bloomberg US Aggregate: 0.04%
Major Headlines
· Consumer Confidence Drops: The Conference Board reported a significant drop in consumer confidence in March, with the index falling to its lowest level in 12 years. [1]
· Federal Reserve Interest Rates: The Federal Reserve decided to keep interest rates steady at 4.5% during their March 2025 meeting. [2]
· Economic Growth and Inflation Expectations: The Feds revealed expectations of slower growth and higher core inflation by year end reflecting the impact of recently implemented US tariffs and consequential retaliation. [2]
Sources
1. https://www.wsj.com/livecoverage/stock-market-today-dow-nasdaq-sp500-03-25-2025
2. https://www.jpmorgan.com/insights/outlook/economic-outlook/fed-meeting-march-2025
Model Performance Update
Our Moderate Model Portfolio returned -0.16% during the month of March and has returned 3.55% YTD (See charts below)
Changes to the model portfolio in March
3/7/2025
- Removed XLE (Energy) from Satellite 1
3/11/2025
- Initiated position in VGK (Europe) in Satellite 1
3/18/2025
- Removed HYG (High Yield Corporate Bonds) from Satellite 2
3/24/2025
- Initiated position in CLOX (AAA Rated CLO’s) in Satellite 2
3/25/2025
- Swapped XFIV (5-year US Treasury) for XTEN (10-year US Treasury) in Satellite 2
- Removed QQQ (Tech) and SPMO (Momentum) from Satellite 1
- Trimmed EWC (Canada) and XLI (Industrials) in Satellite 1
- Increased position in VGK (Europe) and Initiated position in BTAL (Market Neutral Anti-Beta) in Satellite 1
- Satellite 1 and Satellite 3 both hold positions in TBIL (3-month Treasury Bills) while we wait for opportunities to deploy cash.
March Performance with Benchmark

YTD Performance with Benchmark

If you were to have any questions regarding the above, please reach out to us to set up a one-to-one meeting to review your situation.
Sincerely,
Bryant Andrus, MSF, CFP®
President
SBC Investment Management
P: (602) 641-5996
M: (319) 520-2033
E: bandrus@sbcinvestmentmanagement.com
DISCLAIMERS
SBC Investment Management’s Monthly and Quarterly Market Summary and Outlook is intended to communicate current economic and capital market information along with the informed perspectives of our investment professionals. All expressions of opinion are subject to change. Past performance may not be indicative of future results. There is no assurance that any of the trends discussed will continue, or that any of the forecasts will occur.
You should not construe any information in this publication as investment, financial, or any other professional advice. Nothing contained in this publication constitutes a recommendation, endorsement, or an offer to buy or sell any securities or other financial instruments. You should conduct your own research or speak to your investment advisor before investing.
SBC Investment Management prepares this material as a resource for its clients. This content is for informational purposes only and does not address the circumstances of any particular individual or entity. You may contact us to discuss the content of this publication within the context of your own financial situation.
Past performance may not be indicative of future results. Different types of investments involve varying degrees of risk. There can be no assurance that the future performance of any specific investment, investment strategy (including the investments and/or investment strategies recommended or undertaken by SBC Investment Management, LLC), or any non-investment related content, referred to directly or indirectly in this piece will be profitable, equal any corresponding indicated historical performance level(s), or prove successful. Due to various factors, including changing market conditions and/or applicable laws, the content may no longer be reflective of current opinions or positions. Moreover, you should not assume that any discussion or information contained in this piece serves as the receipt of, or as a substitute for, personalized investment advice from SBC Investment Management, LLC. Investment performance results published herein do not include investment advisory fees paid, or any other related account expenses. Performance results compiled solely by SBC Investment Management, LLC, have not been independently verified, and do not reflect the impact of taxes on non-qualified accounts.
Historical performance results for investment indices (provided for general comparison purposes only), strategies, models and/or indicators generally do not reflect the deduction of an investment management fee, nor the impact of taxes, the incurrence of which would have the effect of decreasing historical performance results. It should not be assumed that your account holdings correspond directly to any comparative indices.
Our past recommendations and model portfolio results are not a guarantee of future results. Using any graph, chart, formula, or other device to assist in deciding which securities to trade or when to trade them presents many difficulties and their effectiveness has significant limitations, including that prior patterns may not repeat themselves continuously or on any particular occasion. In addition, market participants using such devices can impact the market in a way that changes the effectiveness of such device.
Hypothetical performance results shown in this report and on sbcinvestmentmanagement.com are backtested and do not represent the performance of any account managed by SBC Investment Management, LLC. They were achieved by means of the retroactive application of each of the previously referenced models, certain aspects of which may have been designed with the benefit of hindsight.
The hypothetical backtested performance does not represent the results of actual trading using client assets nor decision-making during the period and does not and is not intended to indicate the past performance or future performance of any account or investment strategy managed by SBC Investment Management, LLC. If actual accounts had been managed throughout the period, ongoing research might have resulted in changes to the strategy, which might have altered returns. The performance of any account or investment strategy managed by SBC Investment Management, LLC will differ from the hypothetical backtested performance results for each factor shown herein for a number of reasons, including without limitation the following:
Although SBC Investment Management, LLC may consider from time to time one or more of the factors noted herein in managing any account, it may not consider all or any of such factors. SBC Investment Management, LLC may (and will) from time to time consider factors in addition to those noted herein in managing any account.
SBC Investment Management, LLC may rebalance an account more frequently or less frequently than annually and at times other than presented herein.
The hypothetical backtested performance results for each strategy include estimated values for transaction costs of buying and selling securities, which may not be accurate. Investment management fees, custody and other costs, and taxes – all of which would be incurred by an investor in any account managed by SBC Investment Management, LLC are not included in performance results. If such costs and fees were reflected, the hypothetical backtested performance results would be lower.
The hypothetical performance does not reflect the reinvestment of dividends and distributions therefrom, interest, capital gains and withholding taxes.
Accounts managed by SBC Investment Management, LLC are subject to additions and redemptions of assets under management, which may positively or negatively affect performance depending generally upon the timing of such events in relation to the market’s direction.
Simulated returns may be dependent on the market and economic conditions that existed during the period. Future market or economic conditions can adversely affect the returns.
SBC Investment Management, LLC is neither a law firm nor a certified public accounting firm. No portion of our website, our newsletter content, or any other correspondence from us should be construed as legal or accounting advice.