
Don’t go chasing headlines
Commentary:
Primarily driven by tariff headlines, April was an incredibly volatile month for global equity markets. The month began with the April 2nd "Liberation Day," when the new administration announced reciprocal tariffs on over 50 countries. As investors priced in the effects of the proposed tariffs, the S&P 500 entered bear market territory, falling over 21% from its February highs. Just a few days after the initial announcement, the administration announced a 90-day pause on many of the proposed tariffs, causing the S&P 500 to have one of its best days on record, advancing nearly 10% in a single day.
As the month progressed, we were met with constant headlines such as "Trade Progress is Being Made" and "No Trade Progress is Being Made," causing global markets to whipsaw back and forth. Ultimately, the S&P 500 recovered most of its early April losses and finished the month down just -0.76%, up nearly 15% from the correction low on April 8th.

How much was chasing headlines by the general market participates versus well-disciplined investing? The amount of volatility and retail flows indicate that a lot of people were chasing headlines OR were reacting to the headlines that were put out there by the administration in the US and in Canada.
The number of countries and markets that have seen major changes has been surprising. In the Great White North (Canada), the political land space within the federal election shifted from a nearly certain Conservative federal government to a Liberal lead government in only 2 months. Words matter; markets and countries react to these words.
Going back to the US Markets, it is important to understand that bear markets often last much longer than initially anticipated and experience multiple rallies exceeding 10% along the way. Historical data from previous bear markets, such as those in 2000-2002, 2007-2009, and 2022 show that these rallies are a normal part of the market cycle.
To illustrate this, let’s examine charts from previous bear markets where the markets rose significantly before ultimately falling lower. Understanding that this type of price action is normal helps us as investors, not feel FOMO (Fear of Missing Out) when we see the markets rally on the latest Tariff news headline.

2000-2003 Bear Market

2008 Bear Market

2022 Bear Market
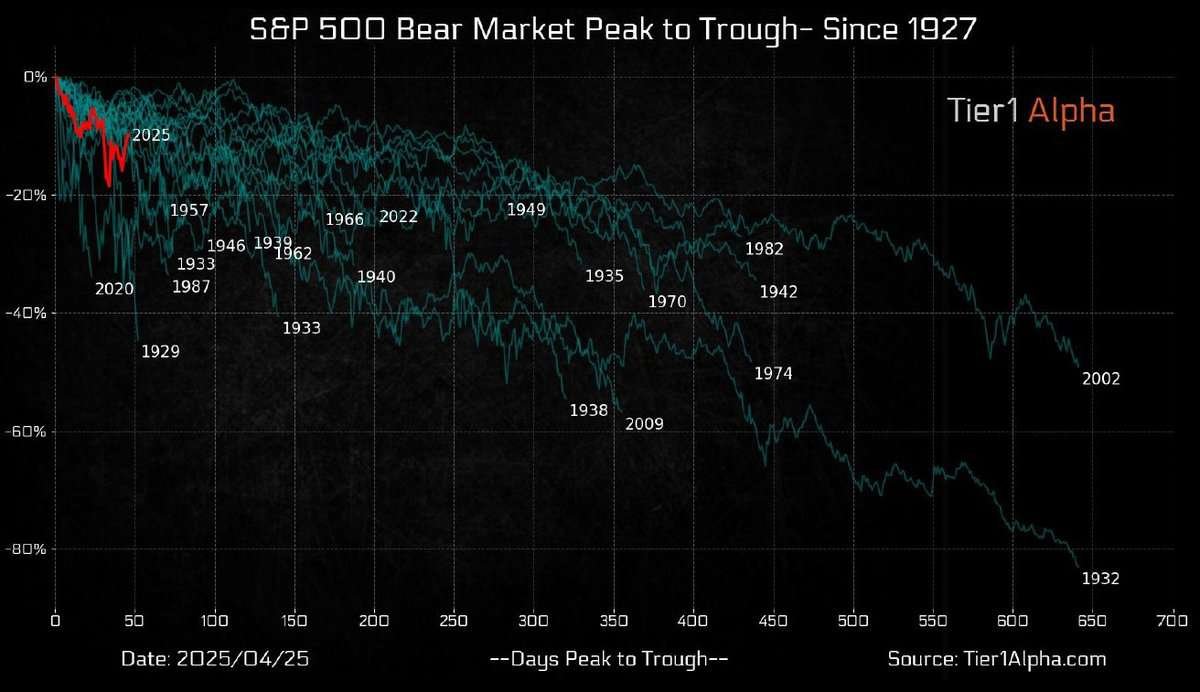
As illustrated by the charts above, bear markets in 2000, 2008, and most recently 2022, each experienced multiple rallies of +10% or even +15% before ultimately returning to new lows. It's important to note that these corrections typically unfold over a longer period, often taking more time than the 33 trading days it took to reach the bottom in 2025. To further illustrate this point, we have included a chart from Tier 1 Alpha that details all previous bear markets since 1927, highlighting the duration and magnitude of corrections from peak to trough.
While it is possible that the market bottom may be in, we remain cautious for reasons beyond those mentioned above. As many of you know, we rely on extensive quantitative data from Hedgeye Risk Management to assist us in our decision-making process. Their GIP model, which stands for Growth, Inflation, and Policy, is a fundamental research framework that categorizes these key components into quadrants to predict the current and future state of the economy. This high-level overview explains how we use the model and its significance. Currently, the model indicates that growth in the United States will continue to slow, therefore we must be cautious when looking to enter growth-oriented sectors. This same model helped us tactically adjust our portfolio in February, allowing us to avoid the major drawdown most portfolios experienced.
Conclusion
Tune out the noise and saber rattling of the media and the administration and focus on the numbers. Adam Smith described the markets using the term “invisible hand.” Stay focused on both the long term and short term goals. Blending the science of investing with the art of investing allows us to continue to prudently manage the short-term risk balanced out with the longer objectives and goals.
Our primary goal is not to time the market bottom but to carefully evaluate market opportunities while maintaining a disciplined investment approach. With approximately 11% cash in our portfolios, we are patiently waiting for buying opportunities to emerge from the Hedgeye models which we have already seen emerge in US sectors such as Consumer Staples and Utilities as well as in international markets like the Eurozone and India. We do expect to see elevated volatility continue in the market thus, we continue to manage our portfolios with an above-normal level of caution.
Model Performance Update
Our Moderate Model Portfolio returned -1.31% during the month of April and has returned 2.19% YTD
Changes to the model portfolio in April
4/8/2025
- Cut remaining position in XLI (Industrials), XLF (Financials), and EWC (Canada) in Satellite 1
4/9/2025
- Increased Exposure to BTAL (Market Neutral Anti-Beta) in Satellite 1
4/22/2025
- Reduced AAAU (Gold) and SIVR (Silver) exposure by Half in Satellite 1
- Replaced LQD (Investment Grade Corporate Bond) with XFIV (Five-year Treasury) in Satellite 2
4/24/2025
- Initiated position in XLP (Consumer Staples) in Satellite 1
4/29/2025
- Added SMIN (India Small Cap) to Satellite 1
5/1/2025
- Removed BTAL (Anti-Beta) and replaced with XLU (Utilities) in Satellite 1
April Performance with Benchmark

YTD Performance with Benchmark

If you were to have any questions regarding the above please reach out to us to set up a one to one meeting to review your situation.
Sincerely,
Bryant Andrus, MSF, CFP®
President
SBC Investment Management
P: (602) 641-5996
M: (319) 520-2033
E: bandrus@sbcinvestmentmanagement.com
DISCLAIMERS
SBC Investment Management’s Monthly and Quarterly Market Summary and Outlook is intended to communicate current economic and capital market information along with the informed perspectives of our investment professionals. All expressions of opinion are subject to change. Past performance may not be indicative of future results. There is no assurance that any of the trends discussed will continue, or that any of the forecasts will occur.
You should not construe any information in this publication as investment, financial, or any other professional advice. Nothing contained in this publication constitutes a recommendation, endorsement, or an offer to buy or sell any securities or other financial instruments. You should conduct your own research or speak to your investment advisor before investing.
SBC Investment Management prepares this material as a resource for its clients. This content is for informational purposes only and does not address the circumstances of any particular individual or entity. You may contact us to discuss the content of this publication within the context of your own financial situation.
Past performance may not be indicative of future results. Different types of investments involve varying degrees of risk. There can be no assurance that the future performance of any specific investment, investment strategy (including the investments and/or investment strategies recommended or undertaken by SBC Investment Management, LLC), or any non-investment related content, referred to directly or indirectly in this piece will be profitable, equal any corresponding indicated historical performance level(s), or prove successful. Due to various factors, including changing market conditions and/or applicable laws, the content may no longer be reflective of current opinions or positions. Moreover, you should not assume that any discussion or information contained in this piece serves as the receipt of, or as a substitute for, personalized investment advice from SBC Investment Management, LLC. Investment performance results published herein do not include investment advisory fees paid, or any other related account expenses. Performance results compiled solely by SBC Investment Management, LLC, have not been independently verified, and do not reflect the impact of taxes on non-qualified accounts.
Historical performance results for investment indices (provided for general comparison purposes only), strategies, models and/or indicators generally do not reflect the deduction of an investment management fee, nor the impact of taxes, the incurrence of which would have the effect of decreasing historical performance results. It should not be assumed that your account holdings correspond directly to any comparative indices.
Our past recommendations and model portfolio results are not a guarantee of future results. Using any graph, chart, formula, or other device to assist in deciding which securities to trade or when to trade them presents many difficulties and their effectiveness has significant limitations, including that prior patterns may not repeat themselves continuously or on any particular occasion. In addition, market participants using such devices can impact the market in a way that changes the effectiveness of such device.
Hypothetical performance results shown in this report and on sbcinvestmentmanagement.com are backtested and do not represent the performance of any account managed by SBC Investment Management, LLC. They were achieved by means of the retroactive application of each of the previously referenced models, certain aspects of which may have been designed with the benefit of hindsight.
The hypothetical backtested performance does not represent the results of actual trading using client assets nor decision-making during the period and does not and is not intended to indicate the past performance or future performance of any account or investment strategy managed by SBC Investment Management, LLC. If actual accounts had been managed throughout the period, ongoing research might have resulted in changes to the strategy, which might have altered returns. The performance of any account or investment strategy managed by SBC Investment Management, LLC will differ from the hypothetical backtested performance results for each factor shown herein for a number of reasons, including without limitation the following:
Although SBC Investment Management, LLC may consider from time to time one or more of the factors noted herein in managing any account, it may not consider all or any of such factors. SBC Investment Management, LLC may (and will) from time to time consider factors in addition to those noted herein in managing any account.
SBC Investment Management, LLC may rebalance an account more frequently or less frequently than annually and at times other than presented herein.
The hypothetical backtested performance results for each strategy include estimated values for transaction costs of buying and selling securities, which may not be accurate. Investment management fees, custody and other costs, and taxes – all of which would be incurred by an investor in any account managed by SBC Investment Management, LLC are not included in performance results. If such costs and fees were reflected, the hypothetical backtested performance results would be lower.
The hypothetical performance does not reflect the reinvestment of dividends and distributions therefrom, interest, capital gains and withholding taxes.
Accounts managed by SBC Investment Management, LLC are subject to additions and redemptions of assets under management, which may positively or negatively affect performance depending generally upon the timing of such events in relation to the market’s direction.
Simulated returns may be dependent on the market and economic conditions that existed during the period. Future market or economic conditions can adversely affect the returns.
SBC Investment Management, LLC is neither a law firm nor a certified public accounting firm. No portion of our website, our newsletter content, or any other correspondence from us should be construed as legal or accounting advice.