
Europe Remains Favorable
Commentary:
May 2025 delivered strong gains across U.S. equity markets, with the S&P 500 up 6.15%, the Nasdaq surging 9.6%, and the Dow rising 3.94%. Much of this performance was driven by mega-cap tech stocks—particularly Nvidia, Microsoft, Amazon, and Alphabet—collectively adding over $2.4 trillion in market cap. Despite rising Treasury yields, investor confidence remained high, buoyed by solid Q1 earnings and a resilient economic backdrop.
The rally was particularly striking given the macroeconomic headwinds. Despite a nearly 25 basis point rise in 10-year Treasury yields, equities remained resilient—suggesting that investors are growing more confident in the economic recovery and less concerned about tighter financial conditions. Meanwhile, U.S. trade tensions briefly flared with a court ruling on tariffs, but markets largely shrugged it off after the decision was stayed.
Importantly, rising yields in the U.S. suggest that investors are beginning to price out recession odds and instead are positioning for a backdrop of accelerating growth and inflation. As such, we’ve begun allocating toward sectors that typically perform well in these environments—chief among them Financials, which benefit from both rising rates and improving economic activity. This rotation could support broader market leadership and sustain the rally through the coming months.
Globally, equity markets also saw positive momentum. European stocks climbed on improved economic data and anticipated rate cuts from the ECB and BoE, while Latin American indices—especially Brazil and Mexico—rebounded strongly after a difficult 2024. China, however, showed mixed results, with continued industrial contraction balanced by targeted stimulus and modest equity gains.
Conclusion:
From a global growth perspective, we continue to favor European equities—particularly Germany (EWG) and Spain (EWP)—as our models currently show fewer macroeconomic headwinds than we are observing in the U.S. This positioning was validated in the second half of May, when SPY returned just -0.18% while EWG and EWP posted gains of 2.72% and 3.66%, respectively. We see room for continued outperformance in these markets if European monetary easing gains traction.

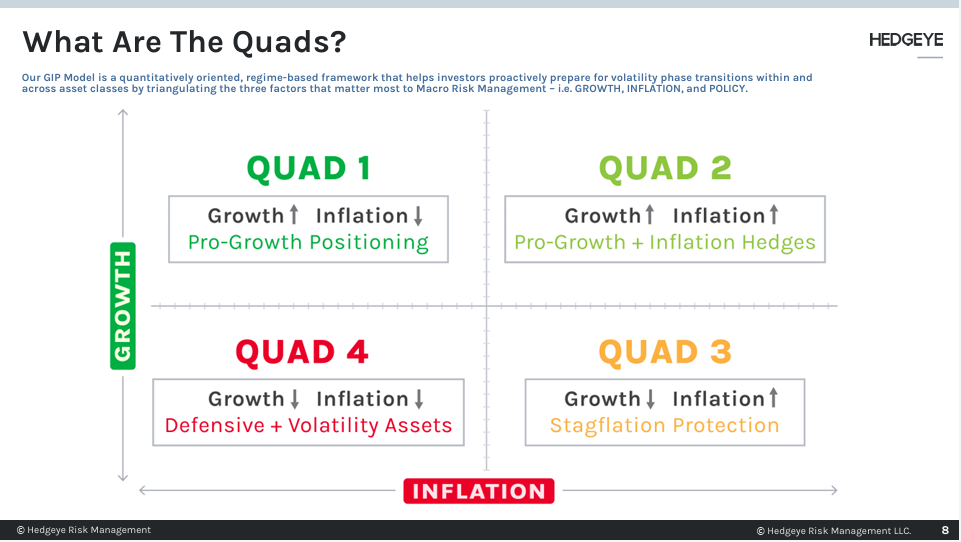
From a U.S. perspective, some indicators—such as rising yields and sector rotation—suggest markets are beginning to price in accelerating growth. We agree with this narrative in the back half of the year; however, we remain cautious in the intermediate term. Our current macro regime analysis points to a U.S Monthly "Quad 4" (growth slowing, inflation slowing) environment in July, which historically has been unfavorable for U.S. equities, and a Quarterly "Quad 3" (growth slowing, inflation rising) for the third quarter as a whole. This contrasts with European equities, where the models project back-to-back "Quad 2" (growth accelerating, inflation accelerating) regimes—a backdrop typically supportive of risk assets and economic expansion. This divergence further reinforces our preference for European exposure at this stage of the cycle.
Market Performance
· S&P 500: 6.15%
· NASDAQ: 9.6%
· MSCI ACWI EX USA: 4.69%
· Bloomberg US Aggregate: -0.72%
Model Performance Update
Our Moderate Model Portfolio returned 1.70% during the month of May and has returned 3.92% YTD
Changes to the model portfolio in May
5/1/2025
- Removed BTAL (Market Neutral Anti-Beta) in Satellite 1
- Added XLU (Utilities) in Satellite 1
5/9/2025
- Added BUXX and XTWO (Two Year Treasury) in Satellite 2
- Removed XTEN (10 Year Treasury) and XSVN (Seven Year Treasury) from Satellite 2
- Reduced exposure to AAAU (Gold) in Satellite 3
5/22/2025
- Added XLF (Financials) in Satellite 1
- Added IAK (Insurance) in Satellite 1
May Performance with Benchmark

YTD Performance with Benchmark

If you were to have any questions regarding the above please reach out to us to set up a one to one meeting to review your situation.
Sincerely,
Bryant Andrus, MSF, CFP®
President
SBC Investment Management
P: (602) 641-5996
M: (319) 520-2033
E: bandrus@sbcinvestmentmanagement.com
DISCLAIMERS
SBC Investment Management’s Monthly and Quarterly Market Summary and Outlook is intended to communicate current economic and capital market information along with the informed perspectives of our investment professionals. All expressions of opinion are subject to change. Past performance may not be indicative of future results. There is no assurance that any of the trends discussed will continue, or that any of the forecasts will occur.
You should not construe any information in this publication as investment, financial, or any other professional advice. Nothing contained in this publication constitutes a recommendation, endorsement, or an offer to buy or sell any securities or other financial instruments. You should conduct your own research or speak to your investment advisor before investing.
SBC Investment Management prepares this material as a resource for its clients. This content is for informational purposes only and does not address the circumstances of any particular individual or entity. You may contact us to discuss the content of this publication within the context of your own financial situation.
Past performance may not be indicative of future results. Different types of investments involve varying degrees of risk. There can be no assurance that the future performance of any specific investment, investment strategy (including the investments and/or investment strategies recommended or undertaken by SBC Investment Management, LLC), or any non-investment related content, referred to directly or indirectly in this piece will be profitable, equal any corresponding indicated historical performance level(s), or prove successful. Due to various factors, including changing market conditions and/or applicable laws, the content may no longer be reflective of current opinions or positions. Moreover, you should not assume that any discussion or information contained in this piece serves as the receipt of, or as a substitute for, personalized investment advice from SBC Investment Management, LLC. Investment performance results published herein do not include investment advisory fees paid, or any other related account expenses. Performance results compiled solely by SBC Investment Management, LLC, have not been independently verified, and do not reflect the impact of taxes on non-qualified accounts.
Historical performance results for investment indices (provided for general comparison purposes only), strategies, models and/or indicators generally do not reflect the deduction of an investment management fee, nor the impact of taxes, the incurrence of which would have the effect of decreasing historical performance results. It should not be assumed that your account holdings correspond directly to any comparative indices.
Our past recommendations and model portfolio results are not a guarantee of future results. Using any graph, chart, formula, or other device to assist in deciding which securities to trade or when to trade them presents many difficulties and their effectiveness has significant limitations, including that prior patterns may not repeat themselves continuously or on any particular occasion. In addition, market participants using such devices can impact the market in a way that changes the effectiveness of such device.
Hypothetical performance results shown in this report and on sbcinvestmentmanagement.com are backtested and do not represent the performance of any account managed by SBC Investment Management, LLC. They were achieved by means of the retroactive application of each of the previously referenced models, certain aspects of which may have been designed with the benefit of hindsight.
The hypothetical backtested performance does not represent the results of actual trading using client assets nor decision-making during the period and does not and is not intended to indicate the past performance or future performance of any account or investment strategy managed by SBC Investment Management, LLC. If actual accounts had been managed throughout the period, ongoing research might have resulted in changes to the strategy, which might have altered returns. The performance of any account or investment strategy managed by SBC Investment Management, LLC will differ from the hypothetical backtested performance results for each factor shown herein for a number of reasons, including without limitation the following:
Although SBC Investment Management, LLC may consider from time to time one or more of the factors noted herein in managing any account, it may not consider all or any of such factors. SBC Investment Management, LLC may (and will) from time to time consider factors in addition to those noted herein in managing any account.
SBC Investment Management, LLC may rebalance an account more frequently or less frequently than annually and at times other than presented herein.
The hypothetical backtested performance results for each strategy include estimated values for transaction costs of buying and selling securities, which may not be accurate. Investment management fees, custody and other costs, and taxes – all of which would be incurred by an investor in any account managed by SBC Investment Management, LLC are not included in performance results. If such costs and fees were reflected, the hypothetical backtested performance results would be lower.
The hypothetical performance does not reflect the reinvestment of dividends and distributions therefrom, interest, capital gains and withholding taxes.
Accounts managed by SBC Investment Management, LLC are subject to additions and redemptions of assets under management, which may positively or negatively affect performance depending generally upon the timing of such events in relation to the market’s direction.
Simulated returns may be dependent on the market and economic conditions that existed during the period. Future market or economic conditions can adversely affect the returns.
SBC Investment Management, LLC is neither a law firm nor a certified public accounting firm. No portion of our website, our newsletter content, or any other correspondence from us should be construed as legal or accounting advice.