
Inflation Clouds, Market Optimism: June in Review
Commentary:
Markets moved higher in June, as investors looked past mixed economic data and focused on the possibility of lower interest rates in the future. U.S. large-cap stocks reached new record highs, while international stocks continued their strong performance this year. Though not as much as stocks, bonds also posted positive gains for the month.
The S&P 500 rose 4.7% in June and is now up 6.2% for the year, closing above 6,100 for the first time. Small-cap stocks also gained, with the Russell 2000 climbing about 3% for the month, reducing its 2025 loss to -2.6%. International developed markets outperformed once again, with the MSCI EAFE index up 20.3% year-to-date, supported by a weaker U.S. dollar and better earnings outlooks. Core bonds delivered a modest return, bringing the Bloomberg U.S. Aggregate Bond Index to a 4.0% gain for the year.
Economic data showed inflation is slowing, but still above central bank targets. At its June meeting, the Federal Reserve lowered its forecast for U.S. growth in 2025 and raised its year-end inflation estimate to 3.0%. Fed Chair Jerome Powell emphasized the need to stay cautious, especially with tariff-driven price pressures still a concern. Slower job growth in May gave the Fed more room to hold rates steady through the summer.
Conclusion:
Our current market model indicates that the U.S. economy is entering a "Quad 3" regime for the third quarter of 2025—an environment where economic growth slows while inflation rises. To position for this backdrop, we are overweight in Utilities (XLU), Consumer Staples (XLP), and Energy (XLE) within our Satellite 1 allocation. These sectors tend to perform well when pricing power and stable, defensive cash flows are rewarded.
Internationally, we maintain focused exposure to Brazil (EWZ), Mexico (EWW), and Australia (EWA). Each of these countries has a commodity-driven economy that stands to benefit from a weaker U.S. dollar and favorable macroeconomic conditions.
Within Satellite 3, we continue to hold positions in Gold (AAAU) and a broad commodities basket (COM), both of which should benefit from rising inflation in both Quad3 and Quad2.
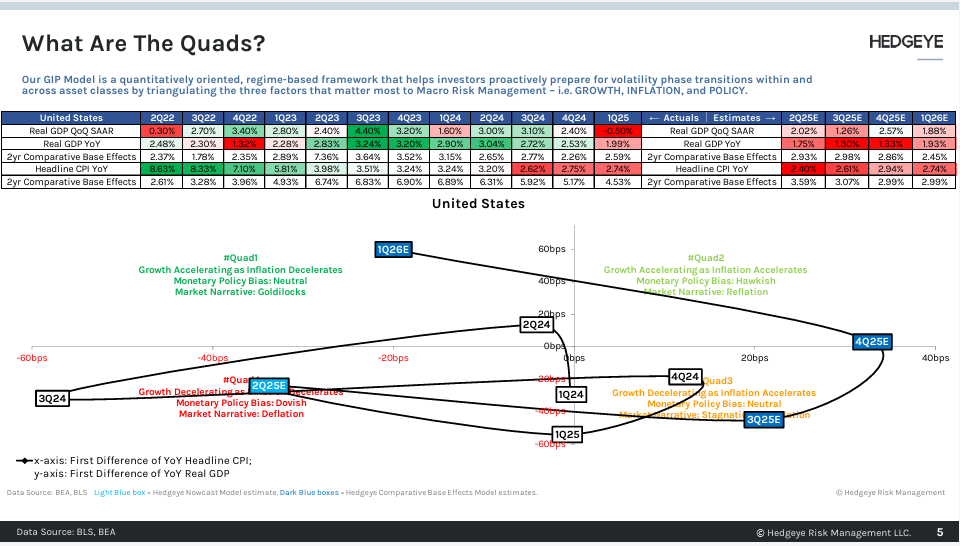
As we look ahead of Q3, the signals show a potential shift to a “Quad 2” regime in Q4 2025—an environment where both growth and inflation accelerate. As such, we are closely watching for early indicators of this transition. If confirmed, we would expect a rotation toward higher-beta assets and inflation hedges, which typically perform well in Quad 2. In that case, we may reduce exposure to more defensive positions like XLP and selectively add to pro-cyclical sectors.
The U.S. dollar remains an important factor. Continued weakness would enhance earnings potential for EWZ, EWW, and EWA, thanks to stronger commodity prices and favorable domestic economic setups. Overall, our approach—grounded in diversified, high-quality equities and real-asset hedges—keeps the portfolio well-positioned for today’s inflation-driven environment, while maintaining flexibility to participate in a broader growth rebound if it emerges.
Model Performance Update
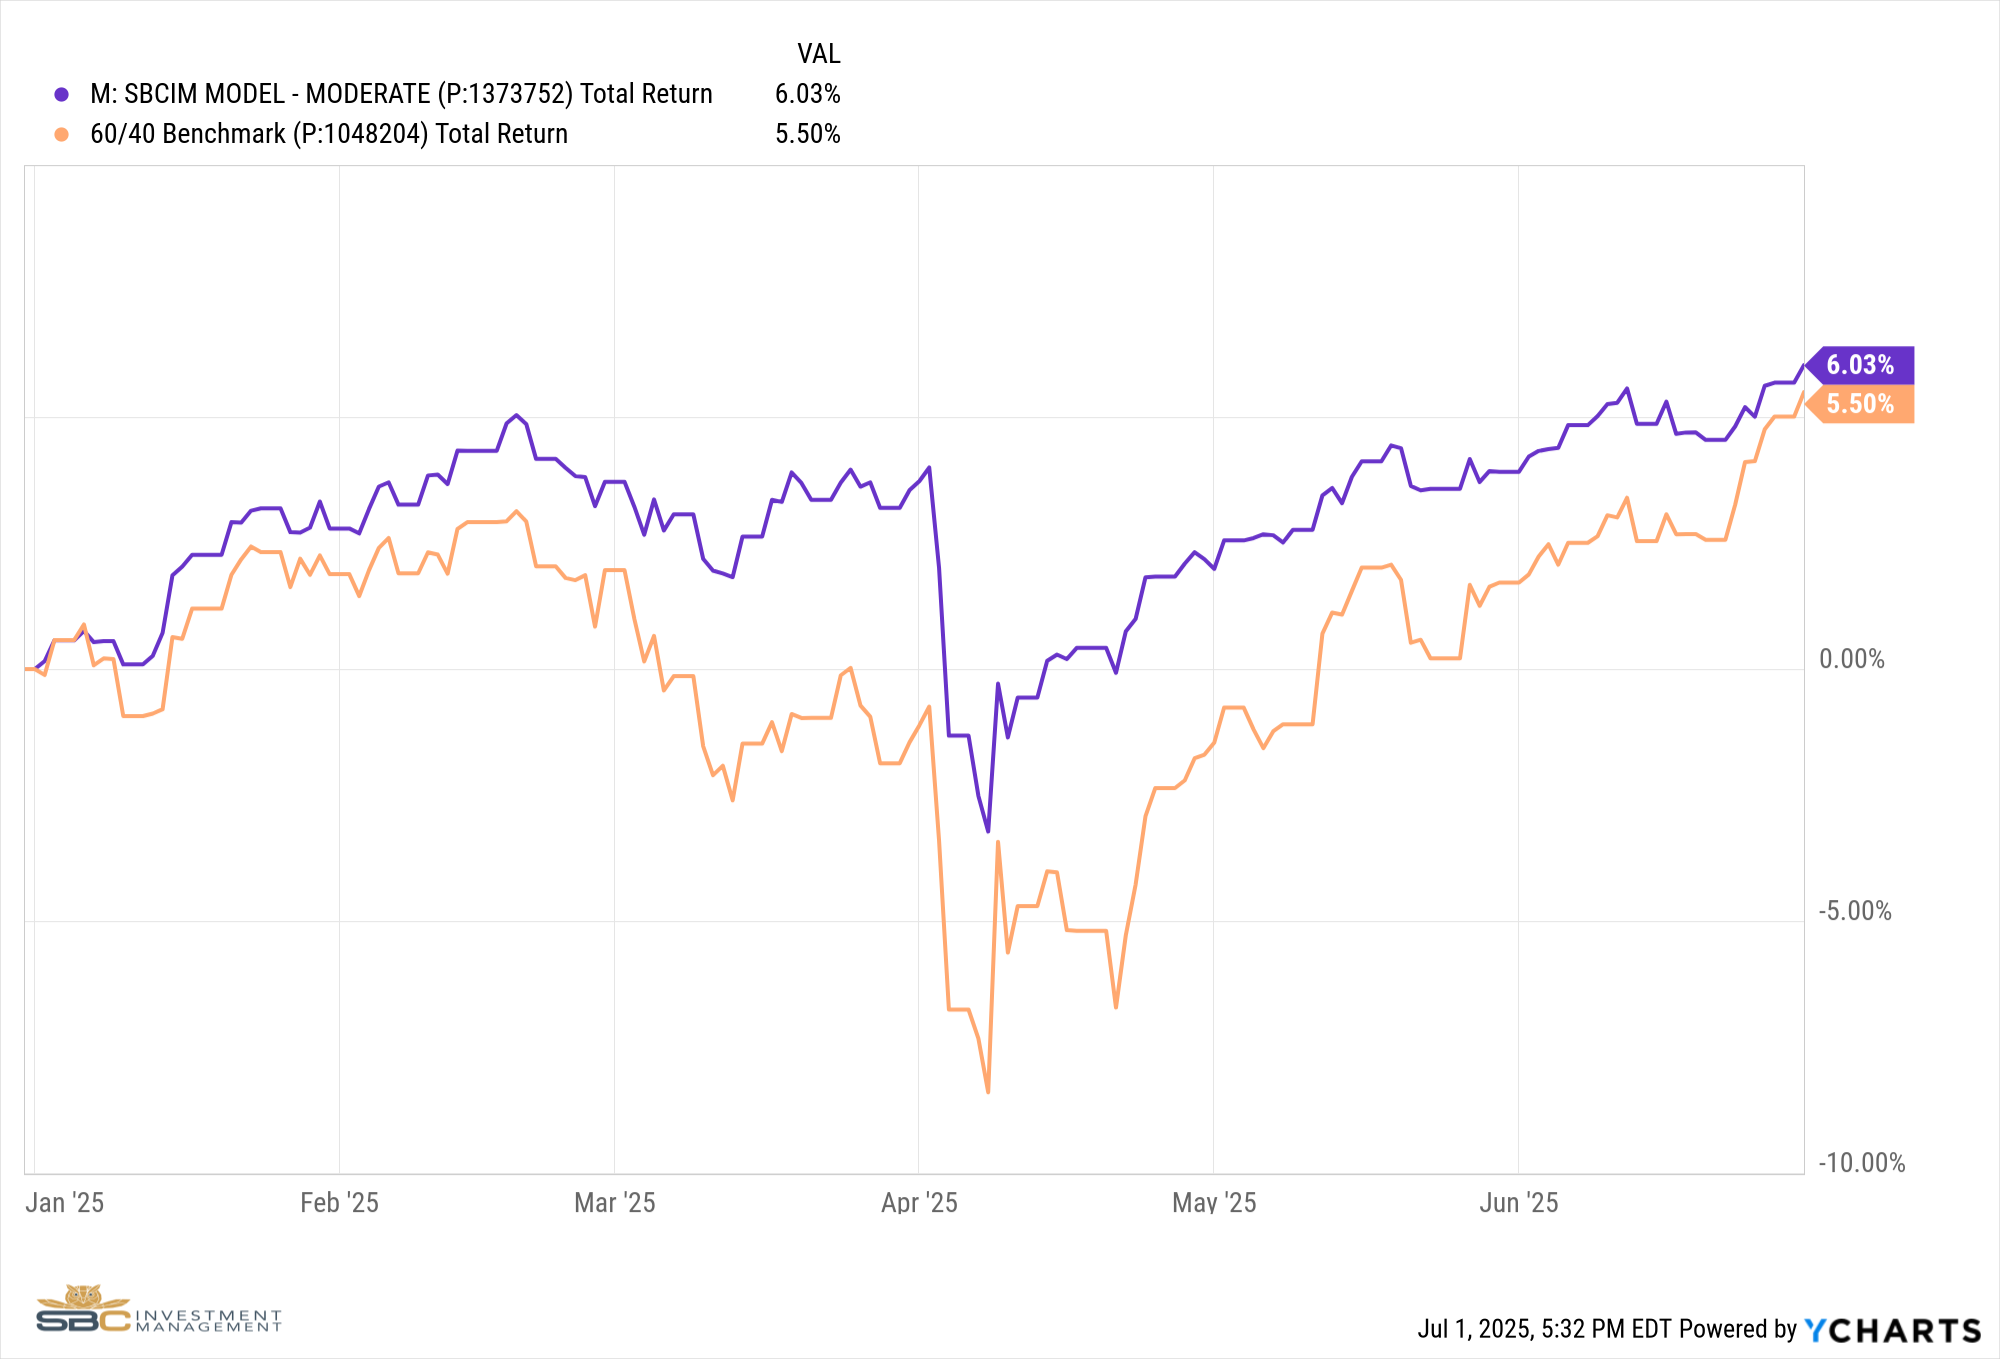
Our Moderate Model Portfolio returned 2.04% during the month of June and has returned 6.03% YTD
Changes to the model portfolio in June
6/3/2025
- Added Australia (EWA) to Satellite 1
6/17/2025
- Added Brazil (EWZ) and Mexico (EWW) to Satellite 1
- Increased Gold (AAAU) position in Satellite 3
6/24/2025
- Replaced Eurozone (VGK) with Global Value (GVAL) while maintaining positions in Germany (EWG) and Spain (EWP) in Satellite 1
- Added Energy (XLE) to Satellite 1
June Performance with Benchmark

YTD Performance with Benchmark
If you were to have any questions regarding the above please reach out to us to set up a one to one meeting to review your situation.
Sincerely,
Bryant Andrus, MSF, CFP®
President
SBC Investment Management
P: (602) 641-5996
M: (319) 520-2033
E: bandrus@sbcinvestmentmanagement.com
DISCLAIMERS
SBC Investment Management’s Monthly and Quarterly Market Summary and Outlook is intended to communicate current economic and capital market information along with the informed perspectives of our investment professionals. All expressions of opinion are subject to change. Past performance may not be indicative of future results. There is no assurance that any of the trends discussed will continue, or that any of the forecasts will occur.
You should not construe any information in this publication as investment, financial, or any other professional advice. Nothing contained in this publication constitutes a recommendation, endorsement, or an offer to buy or sell any securities or other financial instruments. You should conduct your own research or speak to your investment advisor before investing.
SBC Investment Management prepares this material as a resource for its clients. This content is for informational purposes only and does not address the circumstances of any particular individual or entity. You may contact us to discuss the content of this publication within the context of your own financial situation.
Past performance may not be indicative of future results. Different types of investments involve varying degrees of risk. There can be no assurance that the future performance of any specific investment, investment strategy (including the investments and/or investment strategies recommended or undertaken by SBC Investment Management, LLC), or any non-investment related content, referred to directly or indirectly in this piece will be profitable, equal any corresponding indicated historical performance level(s), or prove successful. Due to various factors, including changing market conditions and/or applicable laws, the content may no longer be reflective of current opinions or positions. Moreover, you should not assume that any discussion or information contained in this piece serves as the receipt of, or as a substitute for, personalized investment advice from SBC Investment Management, LLC. Investment performance results published herein do not include investment advisory fees paid, or any other related account expenses. Performance results compiled solely by SBC Investment Management, LLC, have not been independently verified, and do not reflect the impact of taxes on non-qualified accounts.
Historical performance results for investment indices (provided for general comparison purposes only), strategies, models and/or indicators generally do not reflect the deduction of an investment management fee, nor the impact of taxes, the incurrence of which would have the effect of decreasing historical performance results. It should not be assumed that your account holdings correspond directly to any comparative indices.
Our past recommendations and model portfolio results are not a guarantee of future results. Using any graph, chart, formula, or other device to assist in deciding which securities to trade or when to trade them presents many difficulties and their effectiveness has significant limitations, including that prior patterns may not repeat themselves continuously or on any particular occasion. In addition, market participants using such devices can impact the market in a way that changes the effectiveness of such device.
Hypothetical performance results shown in this report and on sbcinvestmentmanagement.com are backtested and do not represent the performance of any account managed by SBC Investment Management, LLC. They were achieved by means of the retroactive application of each of the previously referenced models, certain aspects of which may have been designed with the benefit of hindsight.
The hypothetical backtested performance does not represent the results of actual trading using client assets nor decision-making during the period and does not and is not intended to indicate the past performance or future performance of any account or investment strategy managed by SBC Investment Management, LLC. If actual accounts had been managed throughout the period, ongoing research might have resulted in changes to the strategy, which might have altered returns. The performance of any account or investment strategy managed by SBC Investment Management, LLC will differ from the hypothetical backtested performance results for each factor shown herein for a number of reasons, including without limitation the following:
Although SBC Investment Management, LLC may consider from time to time one or more of the factors noted herein in managing any account, it may not consider all or any of such factors. SBC Investment Management, LLC may (and will) from time to time consider factors in addition to those noted herein in managing any account.
SBC Investment Management, LLC may rebalance an account more frequently or less frequently than annually and at times other than presented herein.
The hypothetical backtested performance results for each strategy include estimated values for transaction costs of buying and selling securities, which may not be accurate. Investment management fees, custody and other costs, and taxes – all of which would be incurred by an investor in any account managed by SBC Investment Management, LLC are not included in performance results. If such costs and fees were reflected, the hypothetical backtested performance results would be lower.
The hypothetical performance does not reflect the reinvestment of dividends and distributions therefrom, interest, capital gains and withholding taxes.
Accounts managed by SBC Investment Management, LLC are subject to additions and redemptions of assets under management, which may positively or negatively affect performance depending generally upon the timing of such events in relation to the market’s direction.
Simulated returns may be dependent on the market and economic conditions that existed during the period. Future market or economic conditions can adversely affect the returns.
SBC Investment Management, LLC is neither a law firm nor a certified public accounting firm. No portion of our website, our newsletter content, or any other correspondence from us should be construed as legal or accounting advice.