
Tariff Woes
U.S. Stock Market Performance
January 2025 was a dynamic month for the stock market, marked by notable gains and some volatility. Here's a detailed commentary:
U.S. Markets: The S&P 500 rose by 2.7%, driven by strong earnings reports and optimism around economic growth [1]. The Dow Jones Industrial Average outperformed with a 4.7% increase, buoyed by gains in industrial and financial sectors [1]. The Nasdaq Composite saw a more modest gain of 1.86%, as tech stocks faced some headwinds [2].
Global Markets: European markets performed exceptionally well, with the Stoxx Europe 600 index reaching record highs[1]. Asian markets also saw gains, although trading was lighter due to the Lunar New Year[1].
Sector Performance: The health care sector led the gains with a 6.91% increase, driven by strong earnings and positive regulatory developments [2]. Financials also performed well, rising by 6.57% as interest rate expectations stabilized [2]. On the other hand, the information technology sector faced challenges, declining by 2.69% due to concerns over valuations and regulatory scrutiny [2].
Commodities: Gold prices rose by 6.59%, marking their best month since August 2011, as investors sought safe-haven assets amid market volatility[1]. Oil prices saw a slight increase of 1.03%, while natural gas prices dropped significantly by 16.05% due to mild winter weather and oversupply[2].
Overall, January 2025 ended on a positive note for the stock market, with strong earnings reports and global economic developments driving gains. However, investors remain cautious about potential headwinds, including regulatory changes and geopolitical tensions.
References
[1] Equity Market Commentary - January 2025 - Morgan Stanley
[2] Monthly Market Commentary – January 2025 | Park Avenue Securities
Bond Market Performance
In January 2025, the bond market experienced a mix of stability and volatility. Here's a summary of the key points:
U.S. Treasury Bonds: The 10-year Treasury bond yield remained relatively stable, ending the month close to where it started, despite trading within a 30 basis point range[1]. Shorter-term yields (2-, 5-, and 10-year) saw slight declines, while the 30-year yield increased marginally[1].
Municipal Bonds: Municipal bond yields fell for maturities of 15 years and shorter but rose for longer maturities[1]. The Bloomberg Short/Intermediate Municipal Bond Index outperformed the U.S. Treasury Index[1].
Corporate Bonds: The option-adjusted spread for the Bloomberg Corporate Investment Grade Index narrowed slightly, indicating a positive performance for corporate bonds[1]. Both mortgage-backed securities (MBS) and asset-backed securities (ABS) showed positive returns, with commercial MBS performing particularly well[1].
General Comments: The bond market in January was influenced by several factors, including better-than-expected inflation readings and ongoing uncertainty about fiscal and economic policies[1]. The Federal Reserve's decision to keep interest rates unchanged also played a role in maintaining stability[1]. Despite some volatility, the overall performance of bonds was positive, with investors showing a preference for safer assets amid market uncertainties.
References
[1] January 2025 Market Commentary | Breckinridge Capital Advisors
Commentary:
Last month, we wrote about our expectations for 2025 expecting to see periods of fluctuating growth and fluctuating prices. With the unknown effects of policy changes led by a new administration, we anticipated there would be periods of increased volatility along the way, this is exactly what we saw in January.
Momentum from a strong 2024 paired with high optimism for 2025 gave both Domestic and International markets a boost in January. The S&P 500 was on track for a 4% return month before the unveiling of DeepSeek, a Chinese based AI app which defied the logic that only hyperscalers can achieve the best AI models in the world, proving you do not need to spend billions to create efficient AI models. This news led to a pre-market NASDAQ drop of -4% the morning of the 27th, with names like Nvidia down -15%. The initial market reaction was a knee jerk reaction, and while the markets were able to recover most of their losses, the DeepSeek model adds another level of uncertainty we need to watch out for in 2025.
We saw additional volatility just one week after the DeepSeek market scare with the administration imposing punitive tariffs on both Canada and Mexico in an effort to help secure our borders. After another deep selloff to start the week, tariff talks were delayed and the market ultimately pushed back higher eventually reaching all-time highs. This coincides with the narrative for 2025 that we expect to see periods of increased volatility in the markets on both the upside and the downside.
Conclusion:
With the trend of increased volatility expected to continue in 2025, what does this mean for client portfolios? The DeepSeek shock to some of the top market performers, particularly Mag7 companies, is an indication of how sensitive these companies’ stock prices can be during periods when we have valuations at levels as high as they are today.
We have all heard about the concept of diversification within a portfolio and how crucial it is to not put all your eggs in one basket. This concept has proven to be a critical piece of the portfolio management process however, many investors are not maximizing the full benefits of diversification. In probability theory, the law of large numbers, and the underlying risk theories that support diversification, prove that when you select 30 randomly chosen stocks in a portfolio, some will go up when others go down, evidently reducing overall portfolio risk.
This theory works, however, the key to efficient diversification involves looking for assets that tend to not move together. To do this, we bring in the statistical concept of correlation, which measures the extent to which two assets move together. Correlation is measured on a scale of -1 to +1. A correlation of +1 would indicate the two assets always move up and down together in perfect union, where a correlation of -1 would mean the assets move in perfect opposite direction. Modern Portfolio Theory stresses that investors should look for consistently uncorrelated (near 0) assets to limit risk.
We have stated many times that we believe a globally diversified portfolio provides the greatest diversification benefit, ultimately leading to higher risk-adjusted returns over long periods of time. These strategic allocations are the foundation of our portfolios. We have and will continue to build our portfolio to reflect this belief. The image below is a correlation matrix of our top 16 holdings in our model portfolios.
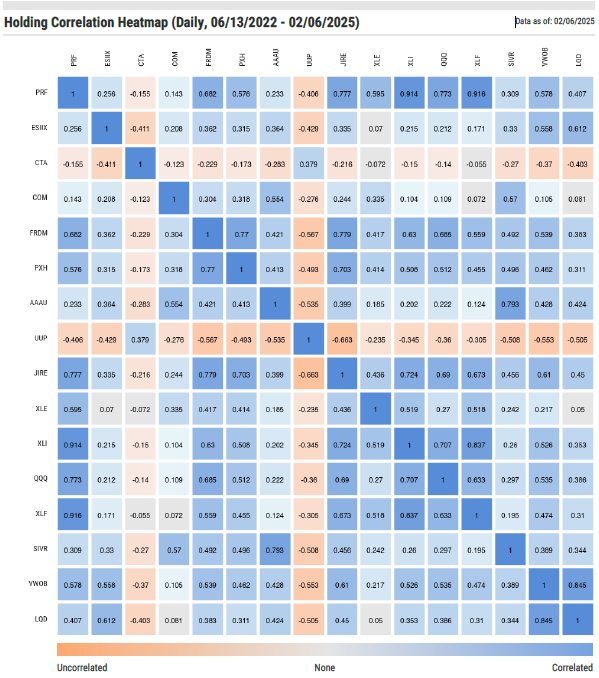
While some securities will have stronger correlations than others, the overall correlations show a broadly diversified base across the assets classes. We believe that constructing a portfolio with a pool of uncorrelated assets is especially crucial as we navigate the year ahead. DeepSeek and Tariff woes have proven how volatile these markets can be. We expect to continue to see more volatility as we digest the effects that DeepSeek will have on US Tech companies as well as what Tariffs and other policy changes may have on both the US and International Economies.
For our Model Portfolios, we have slightly scaled back on some risk by taking some profits on longer term holdings, but continue to remain fully invested in most areas. We will continue to do what our signals tell us to do and document any changes to portfolios and our outlook in our posted articles.
Model Performance Update
Our Moderate Model Portfolio returned 2.79% during the month of January, while the 60/40 Benchmark returned 1.88%.
Changes to the model portfolio in January
1/2/2025 – Removed ARCH and DVN from Satellite 4.
1/14/2025 – Took profits on GDX and increased exposure to UUP and COM in Satellite 3.
January 2025 Performance with Benchmark

If you were to have any questions regarding the above, please reach out to us to set up a one-to-one meeting to review your situation.
Sincerely,
Bryant Andrus, MSF, CFP®
President
SBC Investment Management
P: (602) 641-5996
M: (319) 520-2033
E: bandrus@sbcinvestmentmanagement.com
DISCLAIMERS
SBC Investment Management’s Monthly and Quarterly Market Summary and Outlook is intended to communicate current economic and capital market information along with the informed perspectives of our investment professionals. All expressions of opinion are subject to change. Past performance may not be indicative of future results. There is no assurance that any of the trends discussed will continue, or that any of the forecasts will occur.
You should not construe any information in this publication as investment, financial, or any other professional advice. Nothing contained in this publication constitutes a recommendation, endorsement, or an offer to buy or sell any securities or other financial instruments. You should conduct your own research or speak to your investment advisor before investing.
SBC Investment Management prepares this material as a resource for its clients. This content is for informational purposes only and does not address the circumstances of any particular individual or entity. You may contact us to discuss the content of this publication within the context of your own financial situation.
Past performance may not be indicative of future results. Different types of investments involve varying degrees of risk. There can be no assurance that the future performance of any specific investment, investment strategy (including the investments and/or investment strategies recommended or undertaken by SBC Investment Management, LLC), or any non-investment related content, referred to directly or indirectly in this piece will be profitable, equal any corresponding indicated historical performance level(s), or prove successful. Due to various factors, including changing market conditions and/or applicable laws, the content may no longer be reflective of current opinions or positions. Moreover, you should not assume that any discussion or information contained in this piece serves as the receipt of, or as a substitute for, personalized investment advice from SBC Investment Management, LLC. Investment performance results published herein do not include investment advisory fees paid, or any other related account expenses. Performance results compiled solely by SBC Investment Management, LLC, have not been independently verified, and do not reflect the impact of taxes on non-qualified accounts.
Historical performance results for investment indices (provided for general comparison purposes only), strategies, models and/or indicators generally do not reflect the deduction of an investment management fee, nor the impact of taxes, the incurrence of which would have the effect of decreasing historical performance results. It should not be assumed that your account holdings correspond directly to any comparative indices.
Our past recommendations and model portfolio results are not a guarantee of future results. Using any graph, chart, formula, or other device to assist in deciding which securities to trade or when to trade them presents many difficulties and their effectiveness has significant limitations, including that prior patterns may not repeat themselves continuously or on any particular occasion. In addition, market participants using such devices can impact the market in a way that changes the effectiveness of such device.
Hypothetical performance results shown in this report and on sbcinvestmentmanagement.com are backtested and do not represent the performance of any account managed by SBC Investment Management, LLC. They were achieved by means of the retroactive application of each of the previously referenced models, certain aspects of which may have been designed with the benefit of hindsight.
The hypothetical backtested performance does not represent the results of actual trading using client assets nor decision-making during the period and does not and is not intended to indicate the past performance or future performance of any account or investment strategy managed by SBC Investment Management, LLC. If actual accounts had been managed throughout the period, ongoing research might have resulted in changes to the strategy, which might have altered returns. The performance of any account or investment strategy managed by SBC Investment Management, LLC will differ from the hypothetical backtested performance results for each factor shown herein for a number of reasons, including without limitation the following:
Although SBC Investment Management, LLC may consider from time to time one or more of the factors noted herein in managing any account, it may not consider all or any of such factors. SBC Investment Management, LLC may (and will) from time to time consider factors in addition to those noted herein in managing any account.
SBC Investment Management, LLC may rebalance an account more frequently or less frequently than annually and at times other than presented herein.
The hypothetical backtested performance results for each strategy include estimated values for transaction costs of buying and selling securities, which may not be accurate. Investment management fees, custody and other costs, and taxes – all of which would be incurred by an investor in any account managed by SBC Investment Management, LLC are not included in performance results. If such costs and fees were reflected, the hypothetical backtested performance results would be lower.
The hypothetical performance does not reflect the reinvestment of dividends and distributions therefrom, interest, capital gains and withholding taxes.
Accounts managed by SBC Investment Management, LLC are subject to additions and redemptions of assets under management, which may positively or negatively affect performance depending generally upon the timing of such events in relation to the market’s direction.
Simulated returns may be dependent on the market and economic conditions that existed during the period. Future market or economic conditions can adversely affect the returns.
SBC Investment Management, LLC is neither a law firm nor a certified public accounting firm. No portion of our website, our newsletter content, or any other correspondence from us should be construed as legal or accounting advice.