
Another Big Year for US Equities
U.S. Stock Market Performance
December 2024 saw a mixed performance in the stock market, with major indices experiencing some volatility towards the end of the year. Here's a summary of the key developments:
Major Index Performance
-The S&P 500 declined by 2.5% in December, marking only its third negative month of the year[2]. Despite this downturn, the index still managed to deliver an impressive 23.31% return for the full year 2024[5].
-The Dow Jones Industrial Average had a particularly challenging month, losing 5.27%, which was its worst monthly performance in more than two years[8]. For the year, the Dow still posted a gain of 12.88%[5].
-In contrast, the Nasdaq Composite showed resilience, managing to eke out a 0.5% gain for the month[8]. This contributed to its strong annual performance of approximately 28.64% for 2024[2].
-Eight out of eleven sectors in the S&P 500 recorded losses in December, with Materials (-10.9%), Energy (-9.6%), and Real Estate (-9.2%) being the hardest hit[2]. On the positive side, Communication Services (+3.5%), Consumer Discretionary (+2.3%), and Technology (+1.1%) managed to post gains[2].
Market Dynamics
-Federal Reserve policy: The Fed's outlook for fewer rate cuts in the coming year contributed to the market's decline[2].
-inflation concerns: The Consumer Price Index rose for the second consecutive month, showing year-over-year inflation of 2.7%[2].
-Tech resilience: Despite overall market weakness, technology stocks demonstrated relative strength, helping the Nasdaq outperform other indices[6].
-Year-end profit-taking: Some analysts attributed the late-year slump to investors locking in gains after a strong year[8].
Despite the December pullback, 2024 was an exceptionally strong year for US equities. The S&P 500 hit 57 new highs during the year, the fifth-most in history[2]. Growth stocks significantly outperformed value stocks, and large-cap technology companies continued to have an outsized influence on overall market performance[2].
In conclusion, while December 2024 presented some challenges for the stock market, it did little to dampen the overall positive sentiment for what was a robust year in US equities.
Citations:
[1] https://onewealthmgmt.com/december-2024-market-economic-recap/
[2] https://marksgroup.com/december-2024-market-recap/
[3] https://www.parkavenuesecurities.com/monthly-market-commentary-december-2024
[4] https://extranet.wespath.org/express/WII-Weekly/Weekly-Newsletter-Master.pdf
[5] https://www.spglobal.com/spdji/en/commentary/article/us-equities-market-attributes/
[6] https://www.cnbc.com/2024/12/23/stock-market-today-live-updates.html
[7] https://www.etftrends.com/etf-education-channel/sp-500-dow-nasdaq-since-2000-highs-december-2024/
[8] https://www.investopedia.com/dow-jones-today-12312024-8767710
Bond Market Performance
December 2024 saw a challenging period for the global bond market, with yields generally rising across major economies. Here's a summary of the key developments:
U.S. Treasury Market
- The 10-year Treasury yield rose sharply, increasing by 38 basis points to end the month at 4.58%[3].
- This marked the most substantial one-week rise in 14 months for the 10-year yield[8].
- The 2-year Treasury yield also climbed, though less dramatically, increasing by 14 basis points[8].
Federal Reserve Action
-The Federal Reserve cut interest rates by 25 basis points to 4.25% on December 18[3]. However, this rate cut was accompanied by a hawkish outlook:
- The Fed signaled fewer rate cuts for 2025 than previously expected[1].
- This hawkish stance contributed to the rise in Treasury yields[1].
Corporate Bond Performance
- Investment-grade corporates weakened, returning -1.40%, but outperformed similar-duration Treasuries by 22 basis points[8].
- High-yield corporates returned -0.22%, outperforming similar-duration Treasuries by 26 basis points[8].
- Senior loans bucked the trend, returning 0.24% and marking their 19th straight weekly gain[8].
International Bond Markets
- European bonds saw yields increase, with the French 10-year yield rising by almost 30 basis points to 3.2%[3].
- The German 10-year Bund yield increased by 28 basis points to 2.37%[3].
- Japanese government bonds continued to underperform, falling 0.7% due to expectations of ongoing rate hikes[6].
Municipal Bonds
- Municipal bond yields ended the week generally higher, with short-term yields rising 7 basis points and long-term rates increasing 13 basis points[8].
- Fund flows turned negative after 23 weeks of positive flows[8].
Emerging Markets
- Emerging market bonds returned -0.65% but outperformed similar-duration Treasuries by 71 basis points[8].
- Spreads compressed across investment-grade and high-yield segments in both sovereigns and corporates[8].
Despite the challenging month, 2024 as a whole saw record inflows into global bond funds, with investors taking advantage of some of the highest yields in decades[7]. The bond market's performance in December 2024 reflected ongoing concerns about inflation, central bank policies, and economic growth prospects heading into 2025.
Citations:
[1] https://marksgroup.com/december-2024-market-recap/
[2] https://www.parkavenuesecurities.com/monthly-market-commentary-december-2024
[5] https://advisors.vanguard.com/insights/article/2024-strong-equity-returns
[7] https://www.reuters.com/business/finance/2024-year-bond-record-inflows-top-600-billion-2024-12-17/
[8] https://www.nuveen.com/global/insights/investment-outlook/fixed-income-weekly-commentary
Commentary:
The S&P returned 25% in 2024, this comes after a return of 26% in 2023, the best 2 year stretch since 1997-1998, marking just the 5th time in history that the index has posted back-to-back 20+% returns. In this article, we will look at where those returns came from and what we are expecting to see in the year ahead.
For the second year in a row, market headlines revolved around the “MAG 7”. Rightfully so, these 7 mega-cap companies contributed to most of the market advances in both 2023 and 2024. So much that those 7 companies now make up 34% on the index, up from ~19% just 5 years ago.
As seen below, there has been significant outperformance of the market capitalization weighted S&P 500 compared to the equal weighted index in the last 2 years.


The charts above are just US performance. Many portfolios, ours included, are globally diversified and have allocations outside the US. There are many arguments which we will not get into today that state Global Diversification over long periods of time leads to higher risk-adjusted returns and lowers overall portfolio volatility by holding non-correlated assets. However, in 2024 Global Markets severely underperformed US Markets returning just 6.09%.

On the topic of diversification, the 60/40 allocation was far behind the S&P 500 in 2024. Bonds struggled as inflation remained higher than expected throughout the year, with the Bloomberg US Aggregate ending the year up just 1.25% on a total return basis.

Diversification across different asset classes, industries, and geographic regions is known to reduce the overall risk of an investment portfolio. In fact, it may be considered the most important component needed to have risk-adjusted returns that match your long-term financial goals. Over the last 2 years, we have seen increasing concentration to the top companies in the United States, the success of these few companies has led to market returns that are well above the average market return of 8-10%. History has shown that as markets valuations are as high as we have and as concentration is as large as it is that eventually those trends reverse, and we get a market correction.
Conclusion:
With the markets having experienced such great returns over the last 2 years, what lies ahead for 2025 and beyond? Of the prior 4 instances where the markets returned 20+% in back-to-back years, three out of those four instances saw the markets decline over the subsequent two-year periods. 75% chance of a decline over the next 2 years, right? No, that data is based off a very small sample, the reality is that nobody knows what will happen. Market dynamics are never the same as the past and they constantly evolve and change. In the rest of this article, we will discuss some of the themes we are seeing today and what impacts they may have on economic conditions in 2025. Again, barring any future changes that may occur that will shift these themes.
Let’s start by looking at how Wall Street Analysts view the upcoming year. The chart below shows different firms’ estimated price targets for the S&P 500, and as you can see, estimates are rather optimistic with a Median Price Target of 6600. This would indicate an 8.2% gain for the year.

Notably, not one of these estimates is that of a negative return. This is usually the case with Wall Street as the market has historically had positive annual returns 73% of the time. If you are constantly bullish, you will have a great batting average.
So, we have had back-to-back 20+% return years with analysts projecting another positive year to come. While it is possible, here are some cautionary sings to look out for:
- We have seen severe investor optimism in the markets since late 2022 with record inflows to US ETFs, particularly Leveraged ETF’s.
- Earnings estimates for the S&P 500 continue to be elevated well above historical long-term trends.
- High concentration to the 7 companies mentioned previously, and an implicit presumption that they will continue to be successful.
- Sticky inflation and high interest rates, something that would need to come down to sustain the robust economic growth we have seen.
- We have a rapid increase in the Dollar which has led to a rapid increase in interest rates. If rates rise too high, too fast, it can cause headwinds for US Equities.
- Policy uncertainty, probably the most important is the unknown outcome of proposed Tax Cuts, Tariffs, Deregulation, Immigration, and Deficit / Debt Reduction that has been proposed by the Trump Administration.
With the upcoming administration changes, there are certainly a lot of variables we need to look out for. While there are certainly more elements out there to be cautious of, these are just a few that we wanted to highlight. On the other side of the equation, here are some counter arguments that could suggest these analysts’ estimates are reasonable.
- While the P/E ratio for the S&P 500 is higher, the levels are not insane compared to the past.
- The MAG 7 companies that have seen so much growth are great companies, and have the ability to continue to sustain the profits they have seen. Thus, the elevated P/E ratios we have today might be warranted.
- Aggregate salary and income growth accelerated to 5.79% y/y signaling the consumers ability to consume is increasing going into the first half of 2025, this is a positive factor for equity prices.
- Corporate credit spreads have tightened to record levels indicating strong investor confidence in the economy, especially in the short term.
We subscribe to 3rd party research. One of these parties is Hedgeye Risk Management. Without going into too much detail, one of Hedgeye’s models is their GIP (Growth Inflation Policy) model. In this model the two factors that are most consequential for forecasting future financial market returns are Economic Growth and Inflation. The model tracks both on a y/y rate of change basis to better understand if growth and inflation are heating up or cooling down. This results in four possible outcomes, each which is assigned a “quadrant” and the typical government response as a result. This model is back tested with the chart below showing the different quads and what typically works well or doesn’t work well in each, ranked in order. This helps us use a top-down approach as our principal orientation to get into the bottom up.
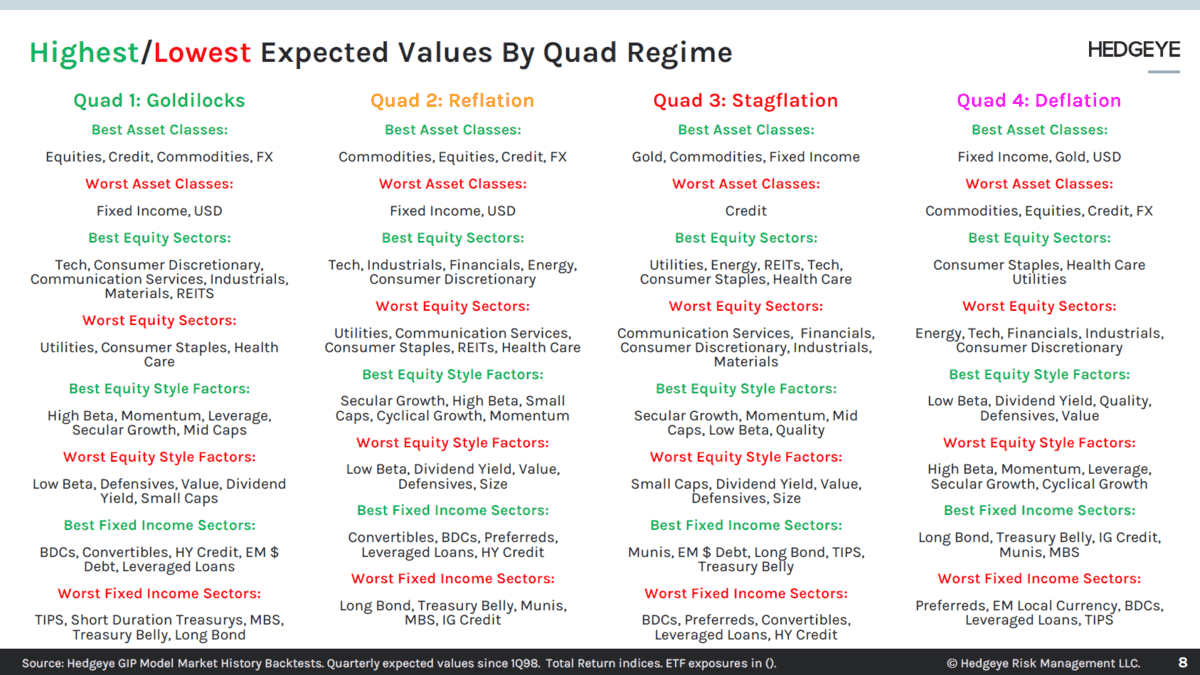
The model is currently signaling a high-frequency GIP chop between Quad2-Quad3 Domestically throughout the first half of 2025. Signaling times of both economic growth and economic contraction. The aspect that remains consistent in both Quad 2 and Quad 3 is that inflation is accelerating in both. The solution to this back-and-forth chop is to own what works well in both. Thus, some of our top allocations in our portfolios going into 2025 are Commodities, Inflation Beneficiaries, Energy, and even Technology. As mentioned previously, this could change on any given day. As we inch closer to the inauguration on January 20th, we will continue to monitor our approach as we assess the implications of the upcoming administrative change and continue to dissect the unknowns that lie ahead.
To summarize, we do believe that 2025 has the potential to be another good year for US Equities. While there are many variables that need to be accounted for, current data suggest we have improving yet complex economic conditions moving forward. Thus, we expect to see periods of fluctuating growth and fluctuating equity prices throughout the year. We will continue to utilize our satellites to play offense and play defense when the signal process tells us it is needed. As policies and economic data changes, we will adapt and shift our allocations accordingly. This process is designed to attempt to continue generating high risk-adjusted returns for our client portfolios. Stay tuned to any future articles where we will discuss the ever-going economic changes as they come and the likely impact they will have on markets and our portfolios.
To our friends and clients that are reading this article, we thank you for being a part of SBC Investment Management. We thank you for your continuous trust in us, here’s to a great year ahead!
Model Performance Update
Our Moderate Model Portfolio returned -2.16% during the month of December and finished the year up 9.31%. While this performance underperformed our benchmark, this is due mostly to our international exposure which lagged domestic performance severely in the 2nd half of 2024. Although we cut our core exposure from 60/40 Domestic/International to 70/30 in Q2 of 2024, a stronger than expected US dollar led to record equity outflows from international markets and record inflows into US markets. (See charts below for performance comparison)
Changes to the model portfolio in September
12/18/2024 - Removed XLU (Utilities), GII (Global Infrastructure), and SPHD (High Dividend, Low Volatility) from Satellite 1
12/18/2024 - Added RSP (S&P Equal Weight), INFL (Inflation Beneficiaries), SPMO (Momentum), PSCI (Small Cap Industrials), and IJT (Small Cap Growth) to Satellite 1
12/18/2024 - Swapped BBN (Taxable Municipal Bonds) for HYG (High Yield Corporate Bonds) in Satellite 2
2024 Performance with Benchmark


If you were to have any questions regarding the above please reach out to us to set up a one to one meeting to review your situation.
Sincerely,
Bryant Andrus, MSF, CFP®
President
SBC Investment Management
P: (602) 641-5996
M: (319) 520-2033
E: bandrus@sbcinvestmentmanagement.com
DISCLAIMERS
SBC Investment Management’s Monthly and Quarterly Market Summary and Outlook is intended to communicate current economic and capital market information along with the informed perspectives of our investment professionals. All expressions of opinion are subject to change. Past performance may not be indicative of future results. There is no assurance that any of the trends discussed will continue, or that any of the forecasts will occur.
You should not construe any information in this publication as investment, financial, or any other professional advice. Nothing contained in this publication constitutes a recommendation, endorsement, or an offer to buy or sell any securities or other financial instruments. You should conduct your own research or speak to your investment advisor before investing.
SBC Investment Management prepares this material as a resource for its clients. This content is for informational purposes only and does not address the circumstances of any particular individual or entity. You may contact us to discuss the content of this publication within the context of your own financial situation.
Past performance may not be indicative of future results. Different types of investments involve varying degrees of risk. There can be no assurance that the future performance of any specific investment, investment strategy (including the investments and/or investment strategies recommended or undertaken by SBC Investment Management, LLC), or any non-investment related content, referred to directly or indirectly in this piece will be profitable, equal any corresponding indicated historical performance level(s), or prove successful. Due to various factors, including changing market conditions and/or applicable laws, the content may no longer be reflective of current opinions or positions. Moreover, you should not assume that any discussion or information contained in this piece serves as the receipt of, or as a substitute for, personalized investment advice from SBC Investment Management, LLC. Investment performance results published herein do not include investment advisory fees paid, or any other related account expenses. Performance results compiled solely by SBC Investment Management, LLC, have not been independently verified, and do not reflect the impact of taxes on non-qualified accounts.
Historical performance results for investment indices (provided for general comparison purposes only), strategies, models and/or indicators generally do not reflect the deduction of an investment management fee, nor the impact of taxes, the incurrence of which would have the effect of decreasing historical performance results. It should not be assumed that your account holdings correspond directly to any comparative indices.
Our past recommendations and model portfolio results are not a guarantee of future results. Using any graph, chart, formula, or other device to assist in deciding which securities to trade or when to trade them presents many difficulties and their effectiveness has significant limitations, including that prior patterns may not repeat themselves continuously or on any particular occasion. In addition, market participants using such devices can impact the market in a way that changes the effectiveness of such device.
Hypothetical performance results shown in this report and on sbcinvestmentmanagement.com are backtested and do not represent the performance of any account managed by SBC Investment Management, LLC. They were achieved by means of the retroactive application of each of the previously referenced models, certain aspects of which may have been designed with the benefit of hindsight.
The hypothetical backtested performance does not represent the results of actual trading using client assets nor decision-making during the period and does not and is not intended to indicate the past performance or future performance of any account or investment strategy managed by SBC Investment Management, LLC. If actual accounts had been managed throughout the period, ongoing research might have resulted in changes to the strategy, which might have altered returns. The performance of any account or investment strategy managed by SBC Investment Management, LLC will differ from the hypothetical backtested performance results for each factor shown herein for a number of reasons, including without limitation the following:
Although SBC Investment Management, LLC may consider from time to time one or more of the factors noted herein in managing any account, it may not consider all or any of such factors. SBC Investment Management, LLC may (and will) from time to time consider factors in addition to those noted herein in managing any account.
SBC Investment Management, LLC may rebalance an account more frequently or less frequently than annually and at times other than presented herein.
The hypothetical backtested performance results for each strategy include estimated values for transaction costs of buying and selling securities, which may not be accurate. Investment management fees, custody and other costs, and taxes – all of which would be incurred by an investor in any account managed by SBC Investment Management, LLC are not included in performance results. If such costs and fees were reflected, the hypothetical backtested performance results would be lower.
The hypothetical performance does not reflect the reinvestment of dividends and distributions therefrom, interest, capital gains and withholding taxes.
Accounts managed by SBC Investment Management, LLC are subject to additions and redemptions of assets under management, which may positively or negatively affect performance depending generally upon the timing of such events in relation to the market’s direction.
Simulated returns may be dependent on the market and economic conditions that existed during the period. Future market or economic conditions can adversely affect the returns.
SBC Investment Management, LLC is neither a law firm nor a certified public accounting firm. No portion of our website, our newsletter content, or any other correspondence from us should be construed as legal or accounting advice.