
Higher for Longer; Again!?
U.S. Stock Market Performance
Record-Breaking Performance:
- The S&P 500 rose 5.7% for the month, reaching new all-time highs [1][5].
- The Dow Jones Industrial Average surged 7.5%, marking its best month of 2024[1][5].
- The Nasdaq Composite gained 6.21%, its strongest month since May [3].
Market Drivers:
- Post-election optimism: Trump's win reduced uncertainty and boosted investor confidence [3].
- Economic growth: The U.S. economy expanded at a 2.8% annualized rate in Q3[3].
- Rate cut expectations: Slowing growth increased the likelihood of Fed rate cuts [3].
- Seasonal strength: November's traditional market strength contributed to positive sentiment [3].
Sector Performance:
- Semiconductor stocks saw gains, with Lam Research and Nvidia rising over 3% and 2% respectively [2].
- Retail stocks like Macy's and Best Buy gained around 2% ahead of the holiday shopping season [1].
- Tesla shares rose 38% for the month, benefiting from Elon Musk's support of Trump [1].
Other Notable Developments:
- The Russell 2000, focusing on smaller companies, outperformed with a 10.8% monthly gain [2].
- Bitcoin approached $100,000, briefly rising above $98,000 before settling around $97,300[1].
- The 10-year Treasury yield fell to 4.19% by the end of the month [1].
Analysts express optimism for December, citing the continuation of favorable conditions and the potential for a seasonal year-end boost[2]. However, investors will be closely watching the November jobs report, due on Friday, for insights into the Federal Reserve's potential actions regarding interest rates[3].
Citations:
[1] https://www.cbsnews.com/news/stock-market-today-dow-s-p-500-november-best-month-2024/
[2] https://www.cnbc.com/2024/11/29/stock-market-today-live-updates.html
[4] https://www.cnbc.com/2024/12/01/stock-market-today-live-updates.html
[5] https://www.investopedia.com/dow-jones-today-11292024-8753278
Bond Market Performance
Treasury Yields:
- The 10-year U.S. Treasury yield decreased by 4 basis points to 4.40% [1].
- The 2-year yield increased by 7 basis points to 4.38% [1].
- Earlier in the month, the 10-year yield had approached 4.50% before retreating [3].
Corporate Bonds:
- Investment grade corporates gained 0.14% for the week, outperforming similar-duration Treasuries by 2 basis points [1].
- High yield corporates advanced 0.28%, outpacing similar-duration Treasuries by 25 basis points [1].
- Lower-rated corporates, particularly CCC-rated high yield bonds, performed strongly with a 0.40% gain [1].
Municipal Bonds:
- Municipal bond yields were essentially unchanged [1].
- New issue supply was $9.0 billion, with fund inflows of $1.3 billion [1].
Emerging Markets:
- Emerging markets debt advanced 0.29%, beating similar-duration Treasuries by 19 basis points [1].
Analysts and market participants noted several key points for the future:
- The market was pricing in only three more rate cuts over the next 12 months, down from over nine in September [5].
- The Federal Reserve's task was becoming more complex due to slowing inflation progress and economic resilience [5].
- Credit spreads remained tight, with investment-grade spreads at historically low levels [5].
Overall, November 2024 saw the bond market navigating a complex environment of changing economic indicators, central bank policies, and investor sentiment.
Citations:
[1] https://www.nuveen.com/en-us/insights/investment-outlook/fixed-income-weekly-commentary
[2] https://www.parkavenuesecurities.com/monthly-market-commentary-november-2024
[4] https://funds.dws.com/en-ch/inform/markets/market-outlook/market-and-macro/
[5] https://aptuscapitaladvisors.com/around-the-bond-market-november-2024/
Commentary:
Last month, we wrote about the ICE BofAML MOVE Index and its extraordinary climb prior to the election. To recap, in the month leading up to the election, the MOVE Index had advanced nearly 50% while the 10-yr treasury went from its low of 3.62% in mid-September to 4.38% at the end of October. There were many ways you could interpret this action; our interpretation was that potential economic policies placed by either candidate would ultimately lead to inflation lingering longer than initially expected.
As a refresher, the MOVE index is a 30-day market implied measure of bond market volatility. Like VIX measures volatility for equities, the MOVE index measures volatility for bonds. A high MOVE index value is interpreted to mean an increase in Treasury market volatility and potential uncertainty while a low MOVE index indicates low risk and high certainty.
On November 4th, 2024, the MOVE hit a 13-month high of 136 as the bond market feared the uncertainty of the upcoming election and fed meeting. By November 12th, the Index had collapsed down to 99.85, marking its largest 5-day collapse in history. During this time, the 10 Year Treasury Rate rose 12 basis points to 4.45%. Again, implied volatility is a measure of the magnitude of anticipated change in either direction. Having the MOVE index fall by as much as it did while the 10-yr Treasury remained somewhat stable suggests that the rise in yields that we saw in October may be here to stay.

With Republican control of Congress and a conservative Supreme Court majority, the Trump administration has the tools needed to execute its agenda for the next two years. If Trump follows through on his plans for tariffs and mass deportation, we could potentially find ourselves in an environment of higher inflation and lower output. There are also proposed large tax cuts, which may lead to larger deficits and ultimately inflationary effects.
These are just a few examples of proposed policies that could lead to higher inflation. There are plenty of proposed implementations that may lead to disinflation, for instance, the proposal to lower prices by increasing energy production. It is also important to note that policy is not the only thing that affects the rate of inflation. The reality is that we do not know for certain what policies will be implemented and what the outcome on the rate of inflation and economic growth will be under the Trump administration. As policies get implemented and economic data changes, we will continue to do what we have always done, which is adapt and implement strategies to best preserve and grow our client’s capital.
Conclusion:
How does all of this affect our client portfolios? While we remain cautious of potential headwinds, now is not the time to be doing nothing in the markets, especially in areas of the market where we see potential growth. We are overweight in asset classes that will benefit from a higher inflationary environment such as Commodities, Energy, and Gold.
We are cognizant of the implications Scott Bessant’s recent nomination for Treasury Secretary may have on the economy. One of the key bullish drivers we have for gold is an increase in the US deficit and spending levels. With Bessent being known as a fiscal hawk, we have decided to take some profits on gold and reallocate to an asset that would perform well if the US deficits decreased, the US Dollar.
We remain in a globally diversified position as we believe it helps reduce overall investment risk and remain invested in high quality, short-duration bonds. As always, we will continue to monitor market conditions and are prepared to shift our allocations as we see changes.
Model Performance Update
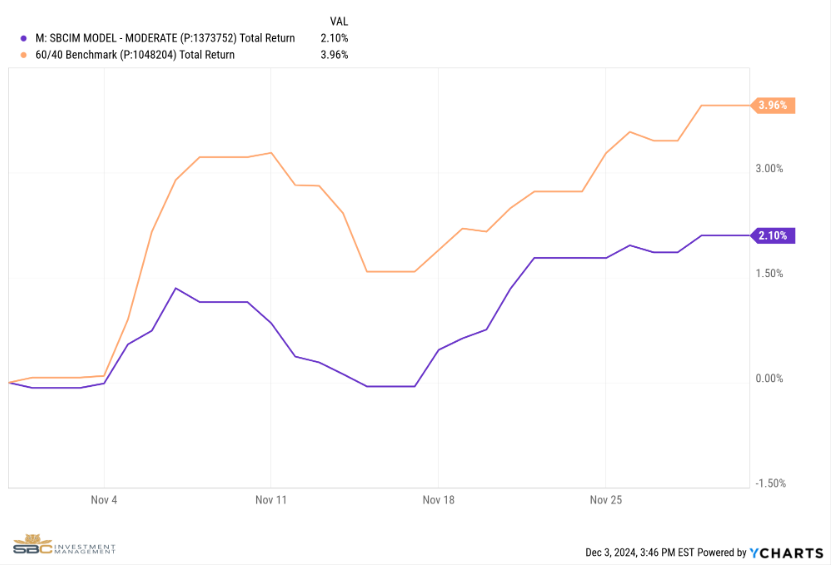
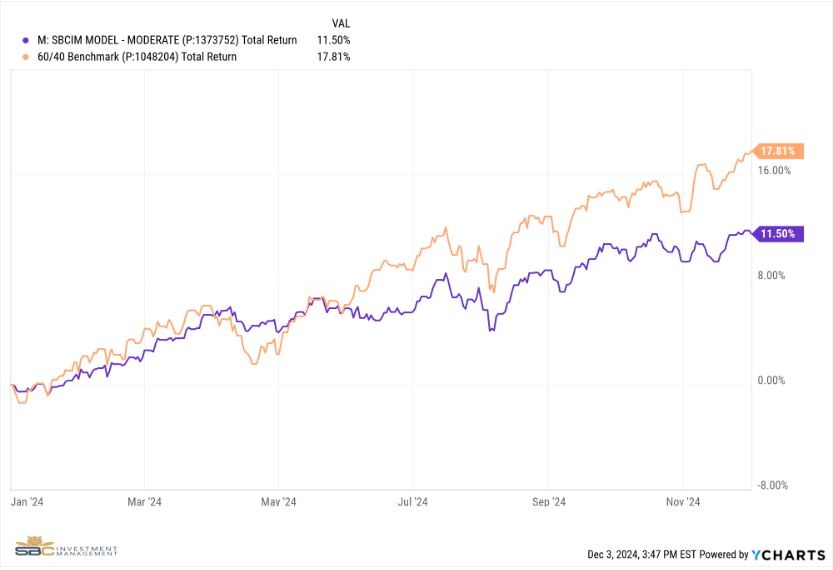
Our Moderate Model Portfolio returned 2.1% during the month of November and finished the month up 11.5% Year to Date (see charts below).
Changes to the model portfolio in September
- Replace XLP (Consumer Staples) with QQQ (Technology)
- Trimmed AAAU (Gold) in half and replaced with UUP (US Dollar)
November 2024 performance with benchmark
YTD Performance with Benchmark
If you were to have any questions regarding the above please reach out to us to set up a one to one meeting to review your situation.
Sincerely,
Bryant Andrus, MSF, CFP®
President
SBC Investment Management
P: (602) 641-5996
M: (319) 520-2033
E: bandrus@sbcinvestmentmanagement.com
DISCLAIMERS
SBC Investment Management’s Monthly and Quarterly Market Summary and Outlook is intended to communicate current economic and capital market information along with the informed perspectives of our investment professionals. All expressions of opinion are subject to change. Past performance may not be indicative of future results. There is no assurance that any of the trends discussed will continue, or that any of the forecasts will occur.
You should not construe any information in this publication as investment, financial, or any other professional advice. Nothing contained in this publication constitutes a recommendation, endorsement, or an offer to buy or sell any securities or other financial instruments. You should conduct your own research or speak to your investment advisor before investing.
SBC Investment Management prepares this material as a resource for its clients. This content is for informational purposes only and does not address the circumstances of any particular individual or entity. You may contact us to discuss the content of this publication within the context of your own financial situation.
Past performance may not be indicative of future results. Different types of investments involve varying degrees of risk. There can be no assurance that the future performance of any specific investment, investment strategy (including the investments and/or investment strategies recommended or undertaken by SBC Investment Management, LLC), or any non-investment related content, referred to directly or indirectly in this piece will be profitable, equal any corresponding indicated historical performance level(s), or prove successful. Due to various factors, including changing market conditions and/or applicable laws, the content may no longer be reflective of current opinions or positions. Moreover, you should not assume that any discussion or information contained in this piece serves as the receipt of, or as a substitute for, personalized investment advice from SBC Investment Management, LLC. Investment performance results published herein do not include investment advisory fees paid, or any other related account expenses. Performance results compiled solely by SBC Investment Management, LLC, have not been independently verified, and do not reflect the impact of taxes on non-qualified accounts.
Historical performance results for investment indices (provided for general comparison purposes only), strategies, models and/or indicators generally do not reflect the deduction of an investment management fee, nor the impact of taxes, the incurrence of which would have the effect of decreasing historical performance results. It should not be assumed that your account holdings correspond directly to any comparative indices.
Our past recommendations and model portfolio results are not a guarantee of future results. Using any graph, chart, formula, or other device to assist in deciding which securities to trade or when to trade them presents many difficulties and their effectiveness has significant limitations, including that prior patterns may not repeat themselves continuously or on any particular occasion. In addition, market participants using such devices can impact the market in a way that changes the effectiveness of such device.
Hypothetical performance results shown in this report and on sbcinvestmentmanagement.com are backtested and do not represent the performance of any account managed by SBC Investment Management, LLC. They were achieved by means of the retroactive application of each of the previously referenced models, certain aspects of which may have been designed with the benefit of hindsight.
The hypothetical backtested performance does not represent the results of actual trading using client assets nor decision-making during the period and does not and is not intended to indicate the past performance or future performance of any account or investment strategy managed by SBC Investment Management, LLC. If actual accounts had been managed throughout the period, ongoing research might have resulted in changes to the strategy, which might have altered returns. The performance of any account or investment strategy managed by SBC Investment Management, LLC will differ from the hypothetical backtested performance results for each factor shown herein for a number of reasons, including without limitation the following:
Although SBC Investment Management, LLC may consider from time to time one or more of the factors noted herein in managing any account, it may not consider all or any of such factors. SBC Investment Management, LLC may (and will) from time to time consider factors in addition to those noted herein in managing any account.
SBC Investment Management, LLC may rebalance an account more frequently or less frequently than annually and at times other than presented herein.
The hypothetical backtested performance results for each strategy include estimated values for transaction costs of buying and selling securities, which may not be accurate. Investment management fees, custody and other costs, and taxes – all of which would be incurred by an investor in any account managed by SBC Investment Management, LLC are not included in performance results. If such costs and fees were reflected, the hypothetical backtested performance results would be lower.
The hypothetical performance does not reflect the reinvestment of dividends and distributions therefrom, interest, capital gains and withholding taxes.
Accounts managed by SBC Investment Management, LLC are subject to additions and redemptions of assets under management, which may positively or negatively affect performance depending generally upon the timing of such events in relation to the market’s direction.
Simulated returns may be dependent on the market and economic conditions that existed during the period. Future market or economic conditions can adversely affect the returns.
SBC Investment Management, LLC is neither a law firm nor a certified public accounting firm. No portion of our website, our newsletter content, or any other correspondence from us should be construed as legal or accounting advice.