
Election Volatility
U.S. Stock Market Performance
The stock market experienced mixed performance in October 2024, with periods of volatility and some notable movements:
Major Indices Performance
The Dow Jones Industrial Average (DJI) and S&P 500 reached new all-time highs during the month. By October 31, the Dow closed at 42,387.57, while the S&P 500 ended at 5,823.52[10].
The Nasdaq Composite also showed gains, closing at 18,567.19 on October 29[10].
Key Drivers
Earnings Season: The third-quarter earnings season kicked off in October, with many major companies, especially in the banking sector, reporting results. Overall, earnings were generally positive, with many firms beating expectations [3][5].
Economic Data: Mixed economic data throughout the month influenced market movements. Inflation readings and employment reports were closely watched by investors[7].
Federal Reserve Policy: The Fed's interest rate decisions and commentary continued to impact market sentiment. There were expectations of potential rate cuts in the near future[2].
Geopolitical Tensions: Events in the Middle East, particularly involving Israel and Iran, affected oil prices and created some market volatility[10].
Sector Performance
Financial and utility sectors showed strength, with the Financial Select Sector SPDR (XLF) and Utilities Select Sector SPDR (XLU) posting gains[10].
Technology stocks experienced some volatility, with major tech companies' earnings reports moving markets[6].
Global Markets
Japanese stocks performed well, with the TOPIX Index showing strong gains[8].
Emerging markets, including Chinese stocks, faced challenges and underperformed compared to developed markets[8].
Fixed Income
Bond yields fluctuated throughout the month, with the 10-year Treasury yield ending around 4.28% by the end of October[7].
Oil Markets
Oil prices saw significant volatility, with a notable drop of about 6% on October 29 due to geopolitical developments[10].
Overall, October 2024 was characterized by new highs for major U.S. indices, strong corporate earnings, and ongoing investor focus on economic data and central bank policies. However, geopolitical tensions and sector-specific performances contributed to some market volatility throughout the month.
Sources
[1] https://finance.yahoo.com/news/stock-market-news-oct-18-090200832.html
[2] https://www.parkavenuesecurities.com/monthly-market-commentary-october-2024
[3] https://finance.yahoo.com/news/stock-market-news-oct-17-150700755.html
[5] https://www.edwardjones.ca/ca-en/market-news-insights/stock-market-news/stock-market-weekly-update
[6] https://apnews.com/article/wall-street-stocks-dow-nasdaq-c5449bdeaa007eb67e98b4519454fa7a
[7] https://www.investopedia.com/dow-jones-today-10112024-8726919
[9] https://www.nerdwallet.com/article/investing/stock-market-outlook
[10] https://finance.yahoo.com/news/stock-market-news-oct-29-131200894.html
[11] https://www.bloomberg.com/news/articles/2024-10-31/stock-market-today-dow-s-p-live-updates
Bond Market Performance
Based on the search results provided, here is a summary of the bond market performance in October 2024:
Treasury Yields
The 10-year Treasury yield fluctuated throughout the month, ending around 4.28% by October 31, 2024[2].
Short-term Treasury yields remained elevated, with the 1-month Treasury rate at 4.93% and the 3-month rate at 4.73%[2].
Corporate Bonds
Investment-grade bond prices declined, ending the month 2.7% lower[8].
In Europe, high-yield bonds outperformed relatively, supported by improving investor sentiment[8].
Global Bond Issuance
S&P Global Ratings revised its 2024 global bond issuance forecast upward to $9 trillion, representing a 17% increase from the previous year[3][6].
The pace of bond issuance is expected to moderate in 2025, with a projected 4% increase due to high 2024 totals and slowing economic growth[3][6].
Short-Term Bond Funds
Short-term bond funds attracted investor interest due to higher interest rates, offering attractive yields[7].
Several short-term bond ETFs and mutual funds showed competitive SEC yields, ranging from 4.97% to 5.42%[7].
Market Factors
Geopolitical tensions, particularly in the Middle East, contributed to market volatility[1].
Investors continued to monitor inflation data and Federal Reserve policy for potential impacts on bond markets[1].
Overall, October 2024 saw a complex bond market environment, with ongoing yield curve inversion, strong global issuance, and varying performance across different bond sectors and regions.
Sources
[1] https://www.blackrock.com/us/individual/insights/blackrock-investment-institute/weekly-commentary
[2] https://ycharts.com/indicators/10_year_treasury_rate
[4] https://www.bloomberg.com/news/articles/2024-10-17/stock-market-today-dow-s-p-live-updates
[5] https://www.statista.com/statistics/1058454/yield-curve-usa/
[7] https://www.bankrate.com/investing/best-short-term-bond-funds/
Commentary:
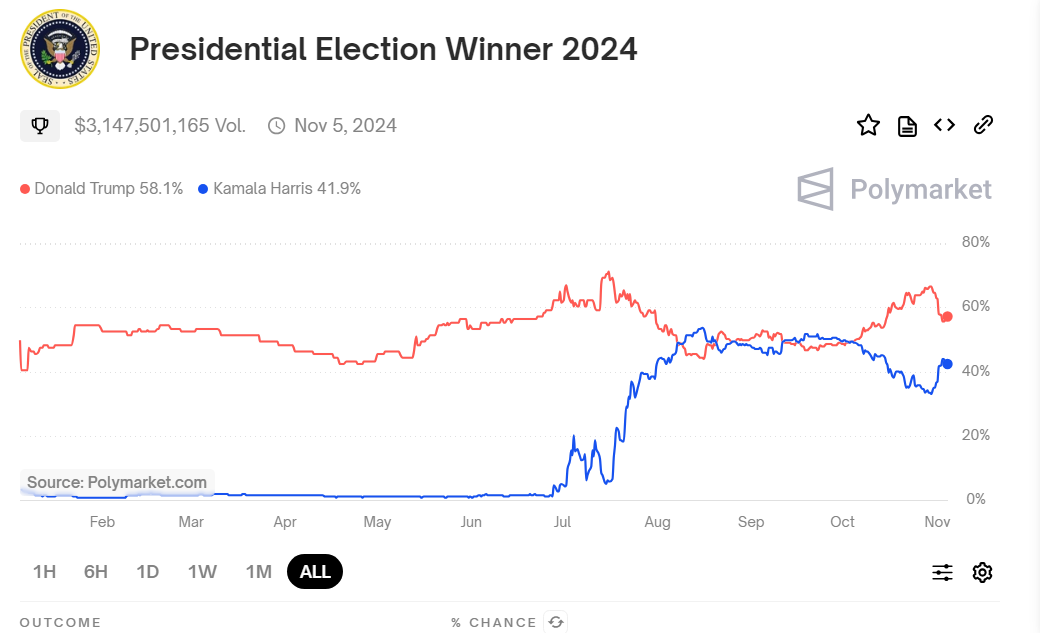
Last month we wrote about stock market volatility leading up to the election. Historically, we have seen the Volatility Index (VIX) rise by an average of 60% in the 2 months leading up to the election, peaking a week before the election at roughly 26.00. At the time of writing this we just one day away from the election, VIX is at 22.1 and is up 47.73% since Sept. 1st, 2024. While today’s numbers are elevated, they are far below historical averages during election cycles. Many of the de-risking many believed would happen ahead of the election, has not yet happened as the S&P has made multiple all-time highs in the month of October. According to Polymarket, Donald Trump is currently favored in the election with a 58% chance of winning. The lack of volatility tells us that investors are confident in the outcome of the election and as we have seen in the past, the market is not always correct when attempting to predict the winner. If Harris comes out of the election with a victory, we may see the markets react negatively. This possibility is something any investor should be aware of.
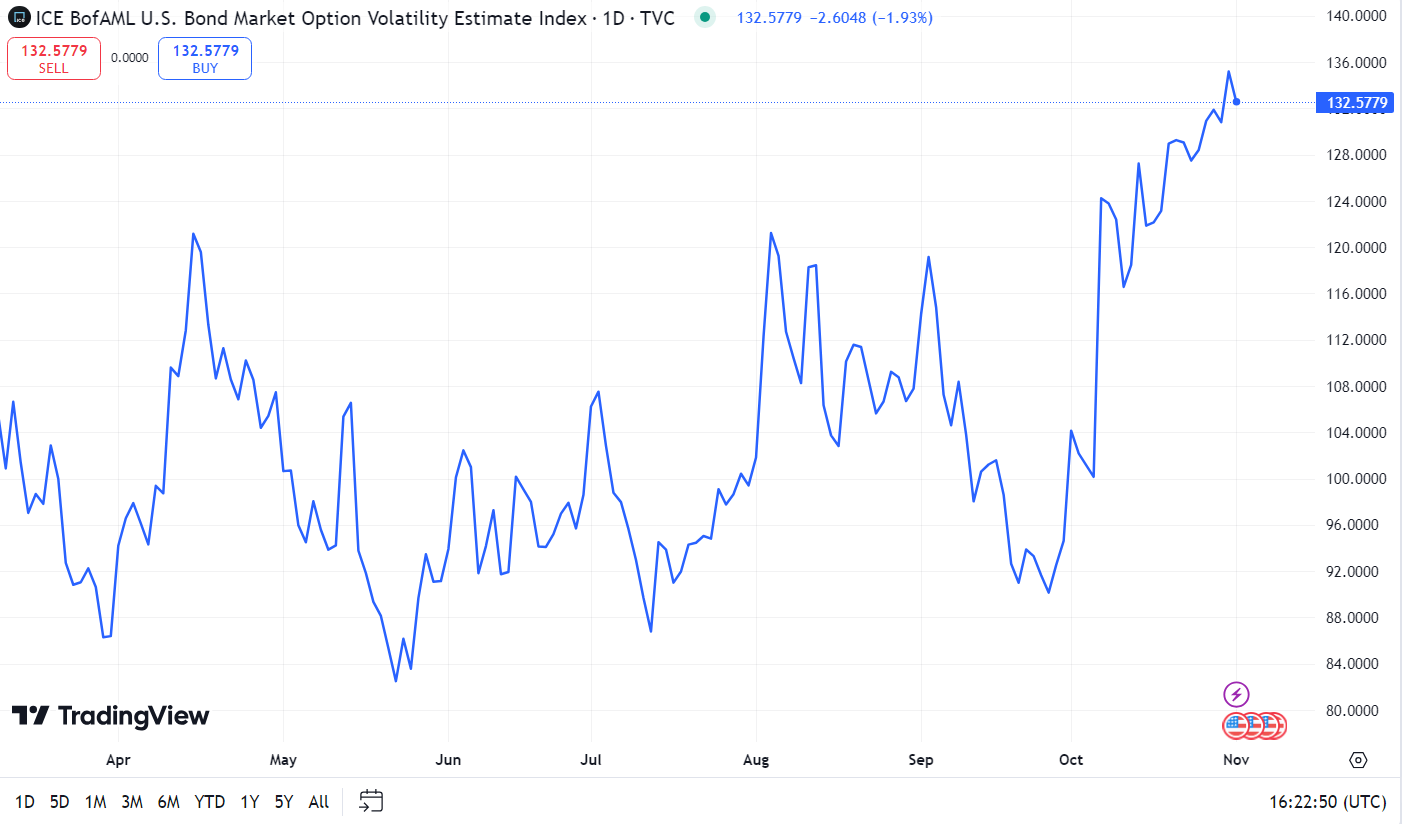
One area of the markets where we have seen a significant increase in implied volatility is in the Bond Market. Bond volatility can be measured by the Merrill Option Volatility Estimate (MOVE) Index, which is up 46.29% m/m to 132.58. The only other times the MOVE index has been this high have been during unexpected events such as the 2020 Covid Crisis and the 2007 Financial Crisis. This volatility began shortly after the federal reserve began the first easing cycle since the 2020 pandemic on September 18th.
Since the September 18th cut, the 10-year treasury rate is up a staggering 58bps to 4.28%. There are many ways we can try to justify this move in interest rates. As we continue to get strong economic data and strong corporate earnings, this suggests the federal reserve may not need to be as aggressive with their cutting cycle as originally anticipated. There is also a large concern regarding the effects each presidential candidate would have on the ever-growing U.S federal budget deficit. Neither candidate for the white house has made tackling the deficit a major campaign priority. Keltons Modern Monetary Theory suggests that if a government controls its own currency and needs money it will simply print more, just as we saw during the 2020 Pandemic. The increase in the supply of money has a historical correlation with an increase in inflation, which typically leads to higher treasury yields on the anticipation of rates remaining higher for longer. While not everyone agrees with this statement, it is something that all investors should be aware of as they are mapping out their portfolio.
Conclusion:
The upcoming presidential election has increased uncertainty across financial markets. The odds of a contested election are high and will likely lead to a political divide in the country. With both candidates presenting markedly different economic policies, much is at stake for investors. As noted in last month’s newsletter, the markets typically do have short term reactions to elections, however, the markets usually find their feet and continue pushing forward in the long run. We remain cautious of the election outcome and have reduced risk as previously noted in past newsletters.
The bond market has seen considerable curve steepening over the past year, curve steepening occurs when short term yields are falling while long term yields are rising. This is typical as the feds begin a rate cutting cycle. Cash yields have come down and are likely to continue to go lower thus, we have moved out of some of our cash positions and gone into intermediate duration positions. We have positioned the bond portion of our portfolio to have an average duration anywhere in the 4–7-year range, we believe this is the most appropriate way to be positioned as we anticipate a further curve steepening. Regardless of the election outcome, investors should be prepared for near-term volatility in both bonds and equities.
Model Performance Update
Our Moderate Model Portfolio returned -0.88% during the month of October and finished the month up 9.45% Year to Date (see chart below).
Changes to the model portfolio in September
Trimmed exposure to PINK, IAK, XLV and KBWP in Satellite 1
Initiated positions in XLE and FRDM in Satellite 1
Swapped IVOL for XFIV in Satellite 2
October 2024 performance with benchmark
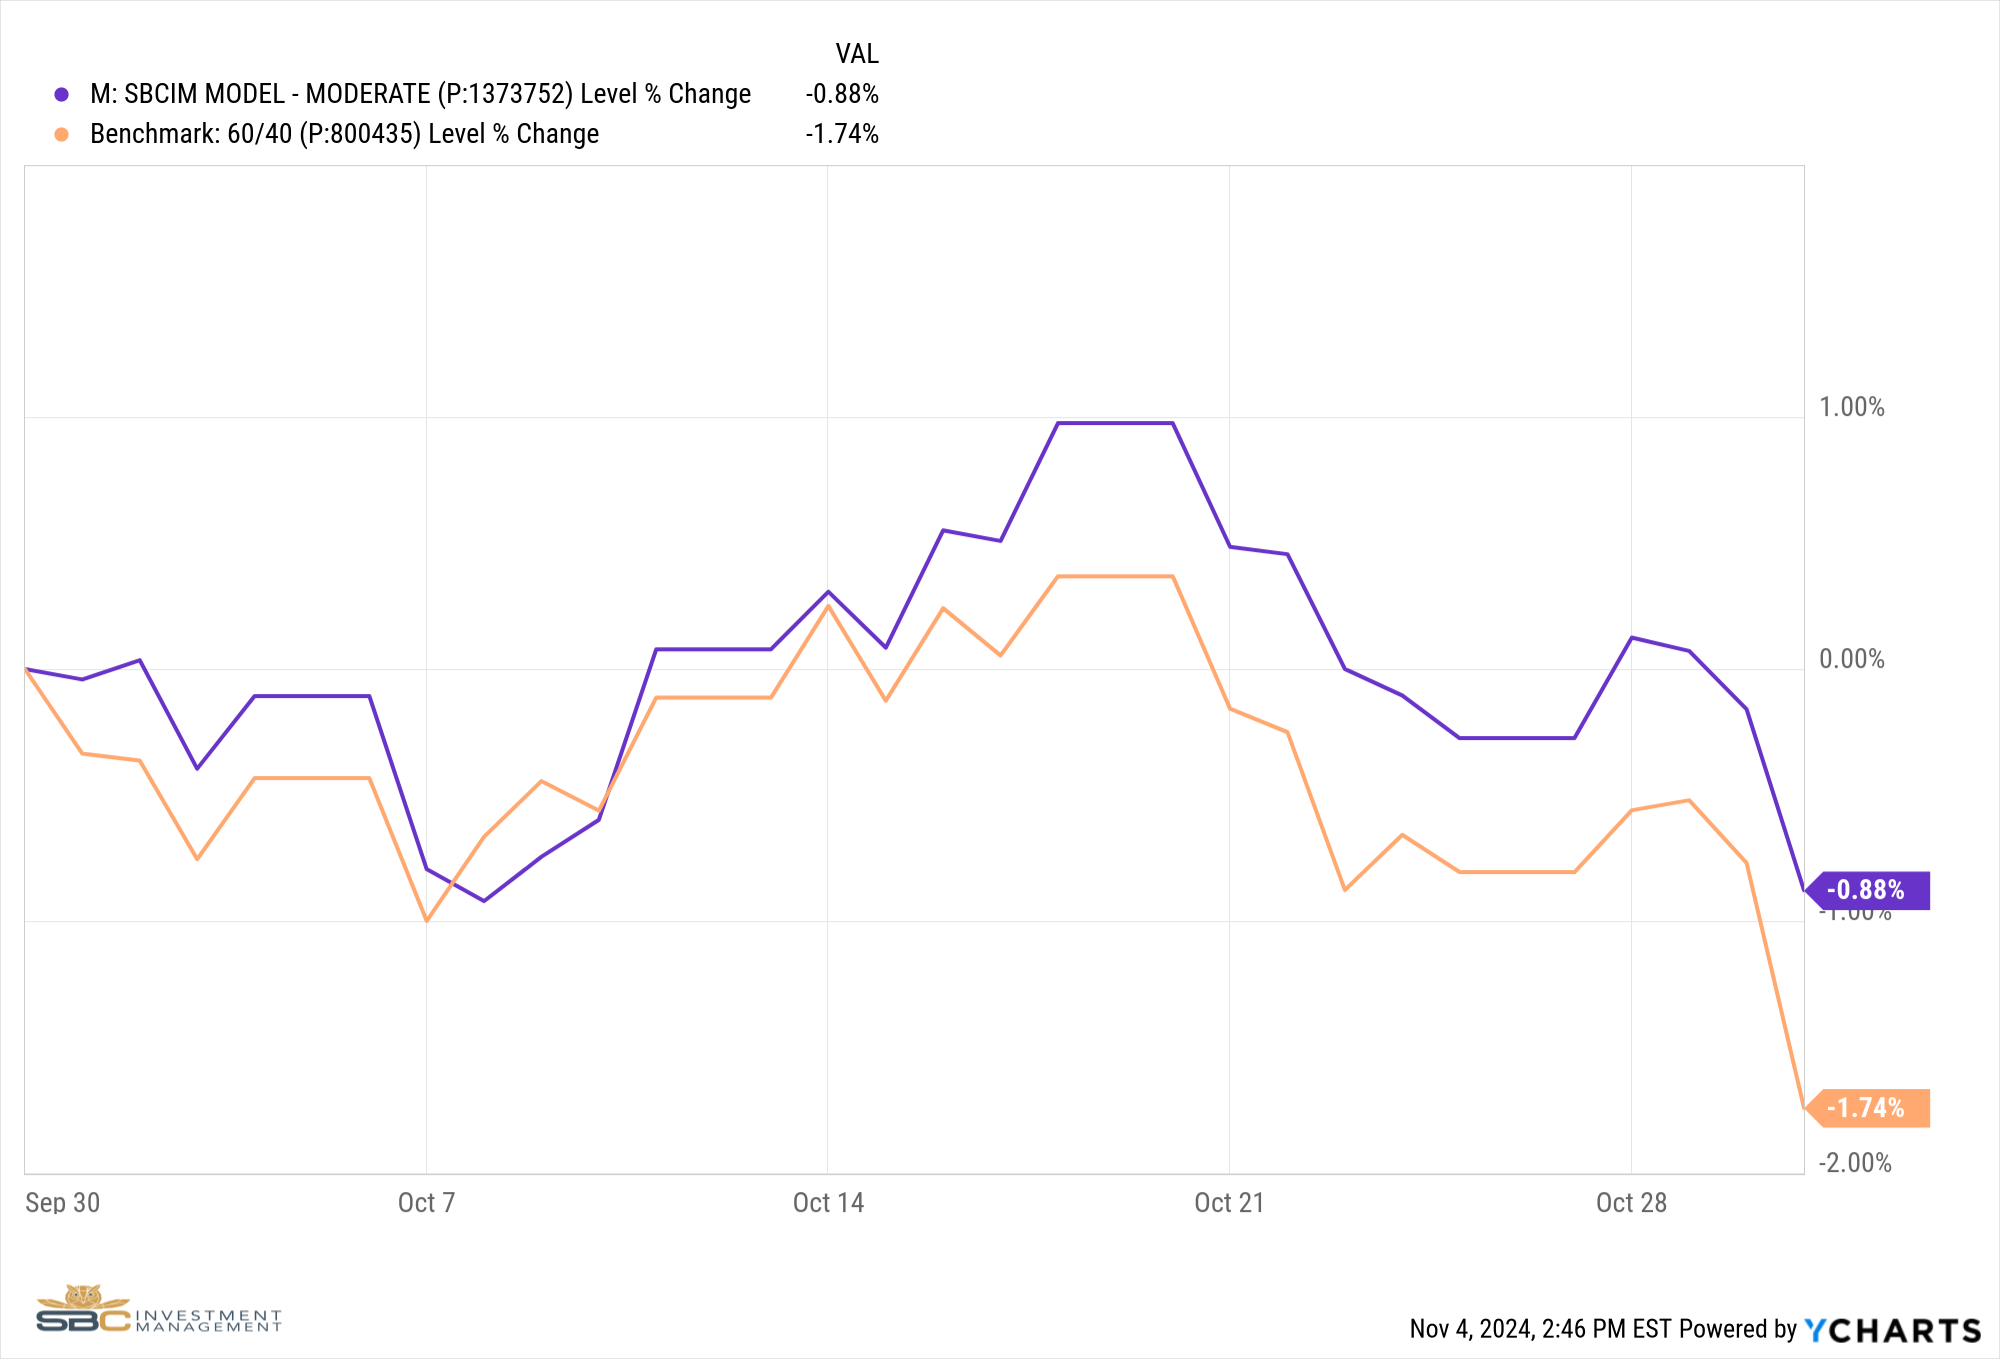
October YTD Performance with Benchmark

If you were to have any questions regarding the above please reach out to us to set up a one to one meeting to review your situation.
Sincerely,
Bryant Andrus, MSF, CFP®
President
SBC Investment Management
P: (602) 641-5996
M: (319) 520-2033
E: bandrus@sbcinvestmentmanagement.com
DISCLAIMERS
SBC Investment Management’s Monthly and Quarterly Market Summary and Outlook is intended to communicate current economic and capital market information along with the informed perspectives of our investment professionals. All expressions of opinion are subject to change. Past performance may not be indicative of future results. There is no assurance that any of the trends discussed will continue, or that any of the forecasts will occur.
You should not construe any information in this publication as investment, financial, or any other professional advice. Nothing contained in this publication constitutes a recommendation, endorsement, or an offer to buy or sell any securities or other financial instruments. You should conduct your own research or speak to your investment advisor before investing.
SBC Investment Management prepares this material as a resource for its clients. This content is for informational purposes only and does not address the circumstances of any particular individual or entity. You may contact us to discuss the content of this publication within the context of your own financial situation.
Past performance may not be indicative of future results. Different types of investments involve varying degrees of risk. There can be no assurance that the future performance of any specific investment, investment strategy (including the investments and/or investment strategies recommended or undertaken by SBC Investment Management, LLC), or any non-investment related content, referred to directly or indirectly in this piece will be profitable, equal any corresponding indicated historical performance level(s), or prove successful. Due to various factors, including changing market conditions and/or applicable laws, the content may no longer be reflective of current opinions or positions. Moreover, you should not assume that any discussion or information contained in this piece serves as the receipt of, or as a substitute for, personalized investment advice from SBC Investment Management, LLC. Investment performance results published herein do not include investment advisory fees paid, or any other related account expenses. Performance results compiled solely by SBC Investment Management, LLC, have not been independently verified, and do not reflect the impact of taxes on non-qualified accounts.
Historical performance results for investment indices (provided for general comparison purposes only), strategies, models and/or indicators generally do not reflect the deduction of an investment management fee, nor the impact of taxes, the incurrence of which would have the effect of decreasing historical performance results. It should not be assumed that your account holdings correspond directly to any comparative indices.
Our past recommendations and model portfolio results are not a guarantee of future results. Using any graph, chart, formula, or other device to assist in deciding which securities to trade or when to trade them presents many difficulties and their effectiveness has significant limitations, including that prior patterns may not repeat themselves continuously or on any particular occasion. In addition, market participants using such devices can impact the market in a way that changes the effectiveness of such device.
Hypothetical performance results shown in this report and on sbcinvestmentmanagement.com are backtested and do not represent the performance of any account managed by SBC Investment Management, LLC. They were achieved by means of the retroactive application of each of the previously referenced models, certain aspects of which may have been designed with the benefit of hindsight.
The hypothetical backtested performance does not represent the results of actual trading using client assets nor decision-making during the period and does not and is not intended to indicate the past performance or future performance of any account or investment strategy managed by SBC Investment Management, LLC. If actual accounts had been managed throughout the period, ongoing research might have resulted in changes to the strategy, which might have altered returns. The performance of any account or investment strategy managed by SBC Investment Management, LLC will differ from the hypothetical backtested performance results for each factor shown herein for a number of reasons, including without limitation the following:
Although SBC Investment Management, LLC may consider from time to time one or more of the factors noted herein in managing any account, it may not consider all or any of such factors. SBC Investment Management, LLC may (and will) from time to time consider factors in addition to those noted herein in managing any account.
SBC Investment Management, LLC may rebalance an account more frequently or less frequently than annually and at times other than presented herein.
The hypothetical backtested performance results for each strategy include estimated values for transaction costs of buying and selling securities, which may not be accurate. Investment management fees, custody and other costs, and taxes – all of which would be incurred by an investor in any account managed by SBC Investment Management, LLC are not included in performance results. If such costs and fees were reflected, the hypothetical backtested performance results would be lower.
The hypothetical performance does not reflect the reinvestment of dividends and distributions therefrom, interest, capital gains and withholding taxes.
Accounts managed by SBC Investment Management, LLC are subject to additions and redemptions of assets under management, which may positively or negatively affect performance depending generally upon the timing of such events in relation to the market’s direction.
Simulated returns may be dependent on the market and economic conditions that existed during the period. Future market or economic conditions can adversely affect the returns.
SBC Investment Management, LLC is neither a law firm nor a certified public accounting firm. No portion of our website, our newsletter content, or any other correspondence from us should be construed as legal or accounting advice.