
Rate cuts and an upcoming election
U.S. Stock Market Performance
In September 2024, the U.S. stock market demonstrated remarkable strength, capping off a robust month and quarter with record-breaking performances across major indices. Here's a comprehensive summary of the key developments:
Market Performance
The S&P 500 climbed 0.4% to reach a new record closing level, while the Nasdaq Composite also rose by nearly 0.4%. The Dow Jones Industrial Average managed to edge slightly higher, marking an all-time high as well. For the month, the Dow was projected to rise by 1.4%, the S&P 500 by 1.5%, and the Nasdaq Composite by 2%[6].
Historical Context
September 2024 defied its historical reputation as a challenging month for stocks. The S&P 500 recorded its strongest year-to-date performance at the end of September since 1997 and experienced its best quarterly performance since the last quarter of 2021[6].
Driving Factors
Federal Reserve Actions: The Fed implemented a larger-than-expected 0.5 percentage point rate cut, reducing the target rate range to 4.75-5.00%[2]. This move, along with signals of further easing, boosted investor confidence.
Economic Data: U.S. economic indicators remained generally positive. Retail sales and industrial production expanded in August, while the unemployment rate edged lower to 4.2%[2].
Inflation Trends: The U.S. headline inflation rate fell to 2.5% (y/y) in August, its lowest reading since early 2021[2].
Global Developments: China's stock market surged after authorities committed to further monetary and fiscal support[2]. However, this had limited impact on U.S. markets.
Sector Performance
The Real Estate sector led gains in the S&P 500, rising more than 0.5%, while the Materials sector lagged, declining 0.8%[6]. Technology stocks, particularly mega-cap names, regained momentum after lackluster performance in July and August[2].
Looking Ahead
Investors are closely watching upcoming economic data, particularly the September jobs report. Analysts project the addition of 130,000 nonfarm payroll jobs, with unemployment expected to remain steady at 4.2%[6]. The market's response to this data could set the tone for the coming months.
In conclusion, September 2024 proved to be an exceptionally strong period for U.S. stocks, driven by accommodative Fed policy, positive economic indicators, and resilient corporate performance. As the market enters the final quarter of the year, investors remain optimistic but cautious, with a keen eye on upcoming economic data and potential policy shifts.
Citations:
[1] https://www.cnbc.com/2024/09/29/stock-market-today-live-updates.html
[3] https://finance.yahoo.com/news/stock-market-news-sep-20-085700528.html
[4] https://www.barrons.com/livecoverage/stock-market-today-093024
[5] https://www.barrons.com/livecoverage/stock-market-today-092724
Bond Market Performance
Yield Movements
The bond market saw generally positive performance in September 2024, with yields on most global government bonds decreasing. The U.S. 10-year Treasury yield fell by 18 basis points to end the month at 3.8%[1]. This decline in yields contributed to positive returns for bond investors, as bond prices move inversely to yields.
Central Bank Actions
A key driver of bond market performance in September was the Federal Reserve's decision to cut interest rates for the first time in four years. The Fed reduced its target rate range by 50 basis points to 4.75%-5.00%[1][2]. This larger-than-expected rate cut boosted investor confidence and contributed to the rally in bond markets.
Global Trends
In Canada, the 10-year government bond yield decreased by 20 basis points to 2.95%[1].
Germany's 10-year Bund mid-yield dropped 15 basis points to 2.13%[1].
Italy's 10-year government bond yield fell by almost 30 basis points to 3.38%[1].
The United Kingdom and Australia were exceptions, with their 10-year yields slightly increasing[1].
Bond Market Performance
The Morningstar US Core Bond Index rose 5.15% for the quarter as yields fell[3]. Global government bonds returned 1.1% in USD hedged terms for September[2]. Investment grade and high yield corporate bonds also saw positive returns, with high yield corporates gaining 1.8% for the month[2].
Inflation and Economic Factors
Inflation continued to moderate, with the U.S. headline inflation rate falling to 2.5% year-over-year in August, its lowest reading since early 2021[2]. This easing of inflationary pressures supported the bond market rally.
Outlook
Strategists expect shorter-term bond yields to continue falling as central banks cut interest rates. However, they anticipate less upside for longer-term yields, as expectations for a soft landing are largely priced into bond markets[3].
In conclusion, September 2024 was a positive month for the bond market, characterized by falling yields, supportive central bank actions, and moderating inflation. These factors contributed to solid returns across various bond sectors.
Citations:
[3] https://www.morningstar.com/markets/13-charts-stocks-bonds-q3-roller-coaster-rallies
[4] https://www.nuveen.com/en-us/insights/investment-outlook/fixed-income-weekly-commentary
[5] https://www.chandlerasset.com/insights/september-bond-market-review-2024-0
[6] https://www.parkavenuesecurities.com/monthly-market-commentary-september-2024-2
Commentary:
As we come to the end of the third quarter of the calendar year, the S&P 500 is up 20.81% year to date. The market has faced many hurdles over the last two years, and time and time again has proven to be resilient regardless of what has been thrown its way. As we enter the 4th Quarter, one of the next major unknowns is the November 5th Presidential Election here in the US.
Historically, October has been known to be a relatively weak month for equities, particularly in election years. Uncertainty always looms ahead of elections, especially when we have a tightly contested race like we are seeing today. The chart below shows the Average Volatility during election years and as we can see, volatility tends to pick up two months prior to the election. As investors become uncertain of election outcomes, they tend to de-risk ahead of the unknown outcome, however, volatility tends to cool down shortly after each election. Once investors have had time to process the results, they gain greater clarity which enables them to proceed with their longer-term investment strategies.

As always, the market will be trying to guess who will win the election, therefore, investors are going to be betting on the outcome to try and get ahead of everyone else. Many of you recall the 2016 election in which the market and all who were polling in the media predicted a landslide democratic win. When the republican candidate won, the world markets had shaky initial reactions, but by the time the US markets opened the next morning the markets had settled and ultimately trended up. This happens because the markets typically dislike uncertainty but once the event that is causing such uncertainty passes, regardless of the outcome, the markets tend to move past it as investors shift their focus to whatever the next crucial event may be. This factor is positive for long-term market participants.
We believe very much in the free market economy. In economic terms, most of what government does is considered dead weight. At times, the best economic periods are those where neither party have full control over all of the checks and balances. The recent polarization of the political parties has started to erode this dynamic, but it is important to understand that we do have checks and balances within the government which allows the markets to continue regardless of who is in the White House.
The American economy is one that we should never bet against, but neither should we hold the position that there are no problems behind the curtains. As the charts in this article show, the volatility of the market during election years is a short-term matter. History has shown that the market as a whole will continue to rise over longer periods.
Conclusion:
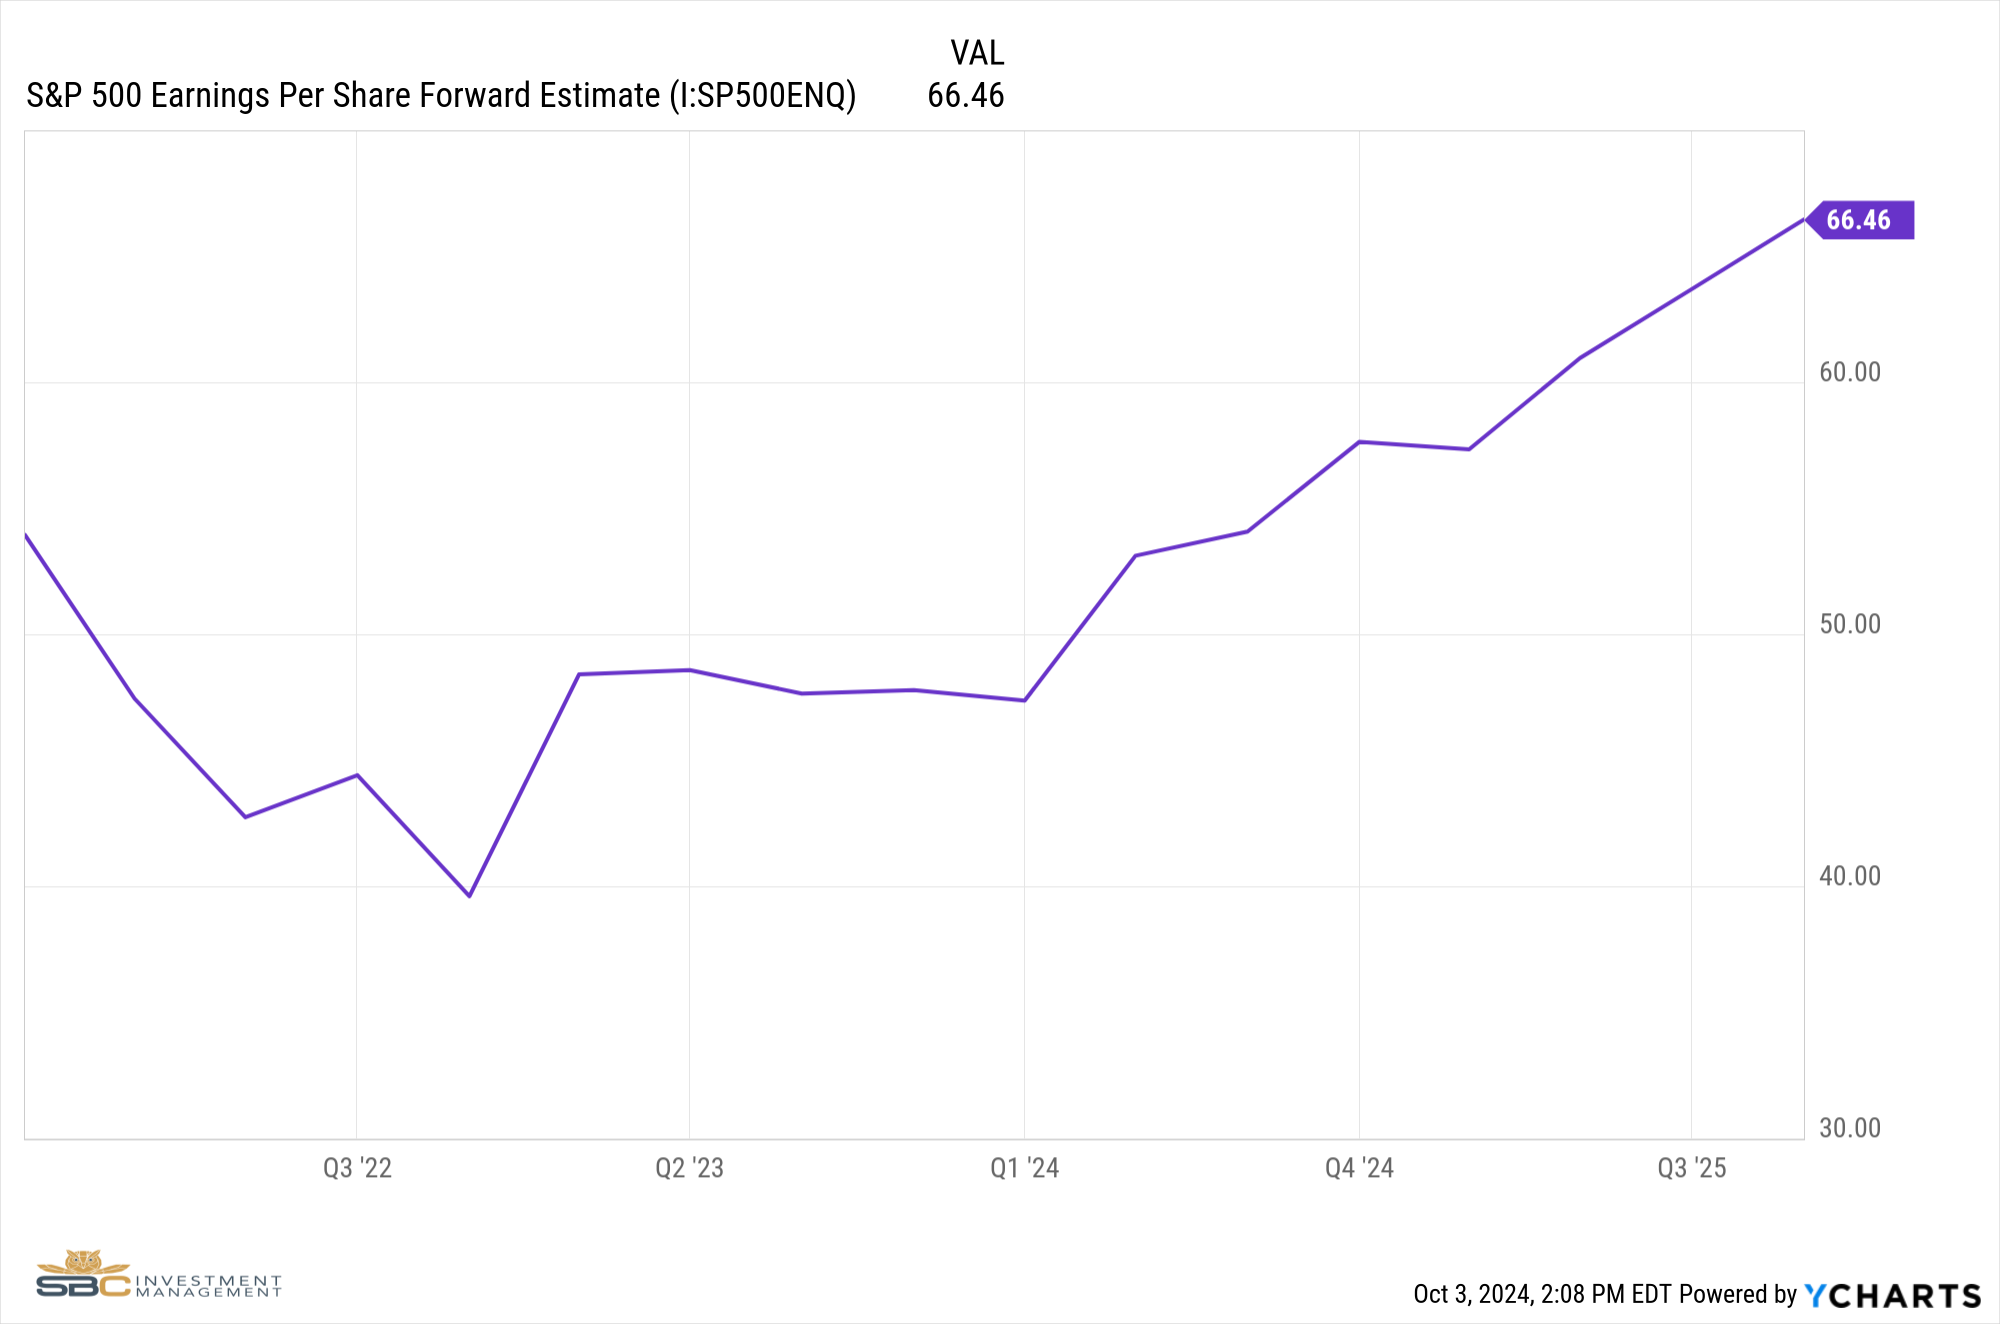
While this short-term volatility is certainly something to be cautious of, as investors we cannot let it deter us from our long-term strategies. As we have seen throughout history, the market does not like uncertainty. But once the “unknown” becomes “known”, while the market may react in the short-term, it ultimately moves past it. The markets are fundamentally driven by earnings growth and as we look beyond the short-term uncertainty of the election, projected earnings for the S&P 500 continue to show growth in 2025. This is another positive factor for those who have a long-term strategy.
While the election may cause noise and negative media headlines, it is important we focus on our long-term portfolio goals, rather than short-term election buzz. As investors, it is easy to get lost and feel panicked when we experience volatility in the markets. The ability to maintain a disciplined approach, relative to your long-term financial goals, is crucial to making it through whatever the markets may throw your way.
Regardless of the outcome of the election, we believe that the overall long-term trend of the market will be positive, as it always has in the past. This does not mean we are ignoring any potential short-term catalysts that may cause volatility in the markets. We have one of our satellites dedicated entirely to alternatives designed to act as crisis alpha in the case of a risk-off event. As mentioned in last month’s newsletter, we have reduced equity risk, especially in areas that depend on economic growth, while increasing allocation to these assets that tend to offset risk in the equity markets. We will continue to process any relevant new data that comes our way and are prepared to act accordingly as we move forward.

Model Performance Update
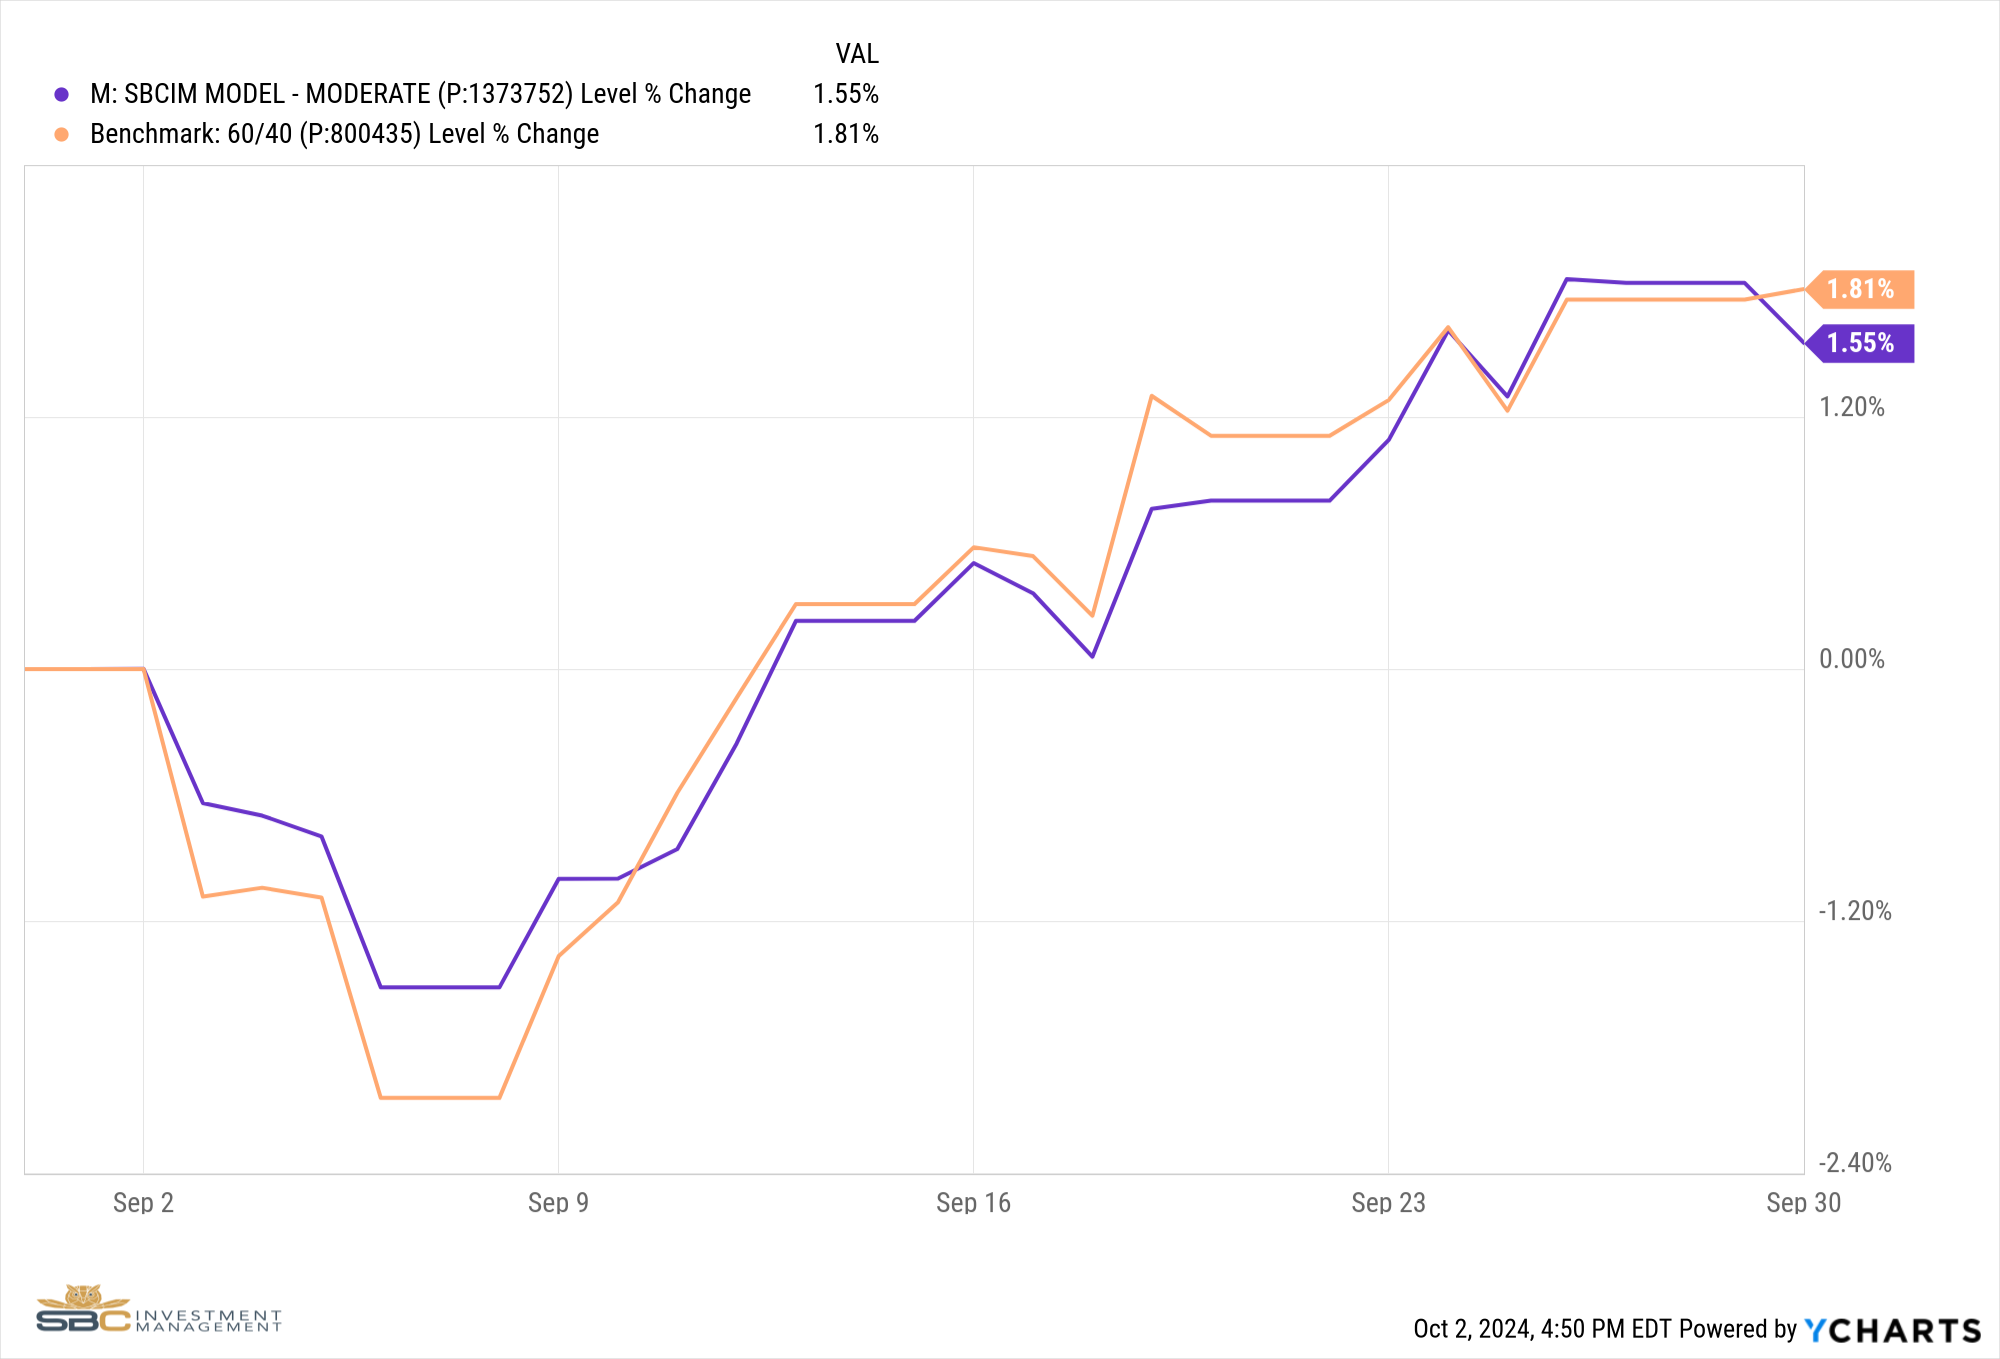
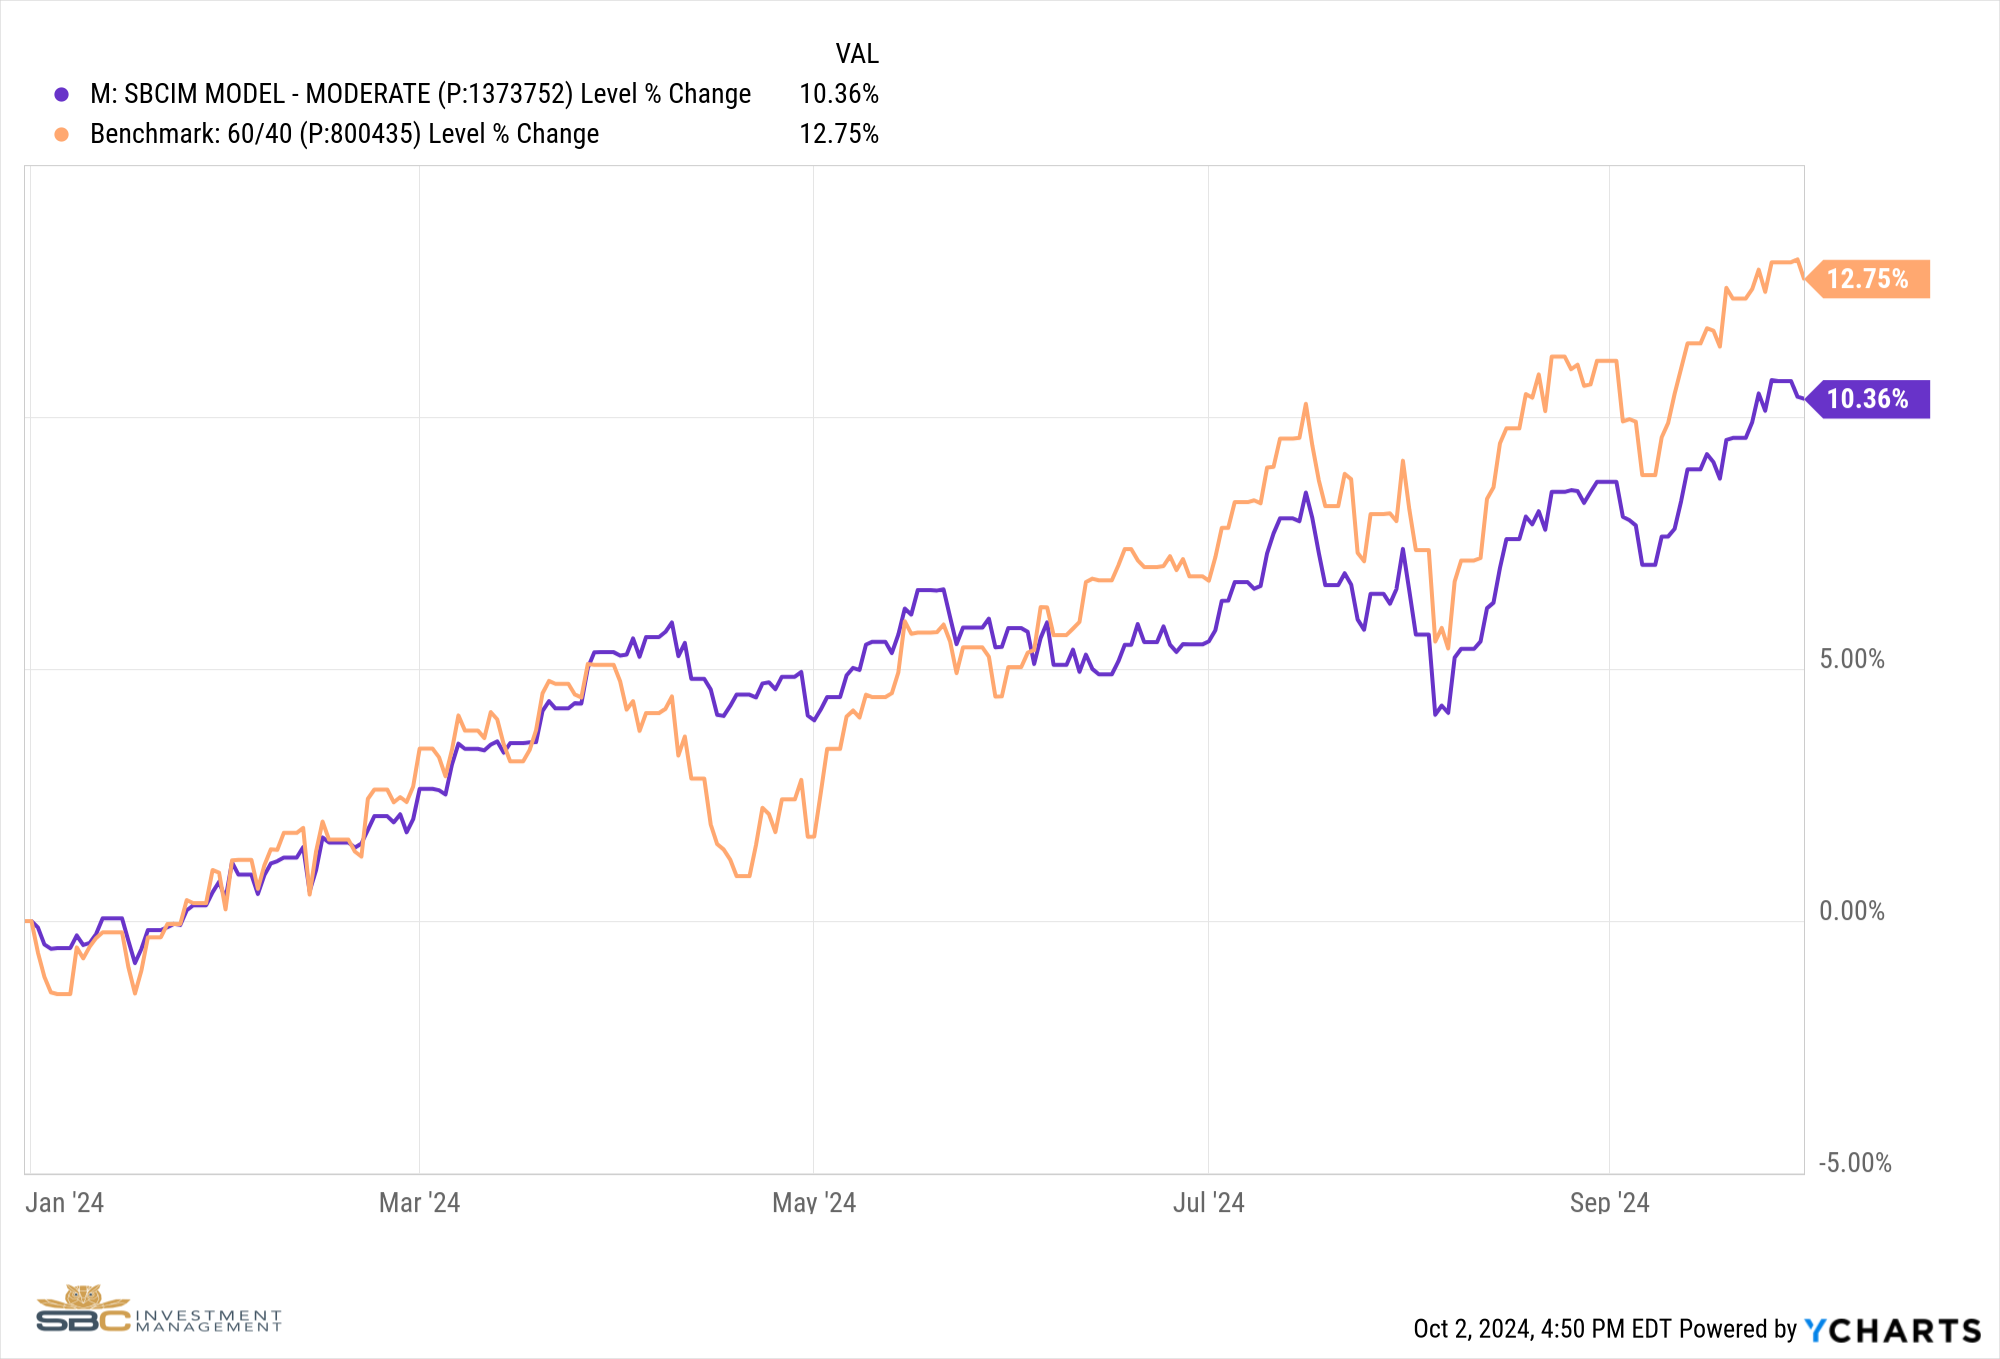
Our Moderate Model Portfolio returned 1.55% during the Month of September and finished the month with a return of 10.36% Year to Date (see chart below).
Changes to the model portfolio in September
- Removed EWN (Netherlands ETF) and XLE (Energy Sector ETF) from Satellite 1
- Added PINK (Simplify Healthcare ETF) to Satellite 1
- Swapped TBIL (US 3 Month Treasury ETF) for XSVN (Bondbloxx Seven Year Duration Treasury ETF) in Satellite 2
- Removed MOV (Movado Group, Inc.) from Satellite 4
September 2024 performance with benchmark
September YTD Performance with Benchmark
If you were to have any questions regarding the above please reach out to us to set up a one to one meeting to review your situation.
Sincerely,
Bryant Andrus, MSF, CFP®
President
SBC Investment Management
P: (602) 641-5996
M: (319) 520-2033
E: bandrus@sbcinvestmentmanagement.com
DISCLAIMERS
SBC Investment Management’s Monthly and Quarterly Market Summary and Outlook is intended to communicate current economic and capital market information along with the informed perspectives of our investment professionals. All expressions of opinion are subject to change. Past performance may not be indicative of future results. There is no assurance that any of the trends discussed will continue, or that any of the forecasts will occur.
You should not construe any information in this publication as investment, financial, or any other professional advice. Nothing contained in this publication constitutes a recommendation, endorsement, or an offer to buy or sell any securities or other financial instruments. You should conduct your own research or speak to your investment advisor before investing.
SBC Investment Management prepares this material as a resource for its clients. This content is for informational purposes only and does not address the circumstances of any particular individual or entity. You may contact us to discuss the content of this publication within the context of your own financial situation.
Past performance may not be indicative of future results. Different types of investments involve varying degrees of risk. There can be no assurance that the future performance of any specific investment, investment strategy (including the investments and/or investment strategies recommended or undertaken by SBC Investment Management, LLC), or any non-investment related content, referred to directly or indirectly in this piece will be profitable, equal any corresponding indicated historical performance level(s), or prove successful. Due to various factors, including changing market conditions and/or applicable laws, the content may no longer be reflective of current opinions or positions. Moreover, you should not assume that any discussion or information contained in this piece serves as the receipt of, or as a substitute for, personalized investment advice from SBC Investment Management, LLC. Investment performance results published herein do not include investment advisory fees paid, or any other related account expenses. Performance results compiled solely by SBC Investment Management, LLC, have not been independently verified, and do not reflect the impact of taxes on non-qualified accounts.
Historical performance results for investment indices (provided for general comparison purposes only), strategies, models and/or indicators generally do not reflect the deduction of an investment management fee, nor the impact of taxes, the incurrence of which would have the effect of decreasing historical performance results. It should not be assumed that your account holdings correspond directly to any comparative indices.
Our past recommendations and model portfolio results are not a guarantee of future results. Using any graph, chart, formula, or other device to assist in deciding which securities to trade or when to trade them presents many difficulties and their effectiveness has significant limitations, including that prior patterns may not repeat themselves continuously or on any particular occasion. In addition, market participants using such devices can impact the market in a way that changes the effectiveness of such device.
Hypothetical performance results shown in this report and on sbcinvestmentmanagement.com are backtested and do not represent the performance of any account managed by SBC Investment Management, LLC. They were achieved by means of the retroactive application of each of the previously referenced models, certain aspects of which may have been designed with the benefit of hindsight.
The hypothetical backtested performance does not represent the results of actual trading using client assets nor decision-making during the period and does not and is not intended to indicate the past performance or future performance of any account or investment strategy managed by SBC Investment Management, LLC. If actual accounts had been managed throughout the period, ongoing research might have resulted in changes to the strategy, which might have altered returns. The performance of any account or investment strategy managed by SBC Investment Management, LLC will differ from the hypothetical backtested performance results for each factor shown herein for a number of reasons, including without limitation the following:
Although SBC Investment Management, LLC may consider from time to time one or more of the factors noted herein in managing any account, it may not consider all or any of such factors. SBC Investment Management, LLC may (and will) from time to time consider factors in addition to those noted herein in managing any account.
SBC Investment Management, LLC may rebalance an account more frequently or less frequently than annually and at times other than presented herein.
The hypothetical backtested performance results for each strategy include estimated values for transaction costs of buying and selling securities, which may not be accurate. Investment management fees, custody and other costs, and taxes – all of which would be incurred by an investor in any account managed by SBC Investment Management, LLC are not included in performance results. If such costs and fees were reflected, the hypothetical backtested performance results would be lower.
The hypothetical performance does not reflect the reinvestment of dividends and distributions therefrom, interest, capital gains and withholding taxes.
Accounts managed by SBC Investment Management, LLC are subject to additions and redemptions of assets under management, which may positively or negatively affect performance depending generally upon the timing of such events in relation to the market’s direction.
Simulated returns may be dependent on the market and economic conditions that existed during the period. Future market or economic conditions can adversely affect the returns.
SBC Investment Management, LLC is neither a law firm nor a certified public accounting firm. No portion of our website, our newsletter content, or any other correspondence from us should be construed as legal or accounting advice.