
The AI Trade Takes Command
TL;DR
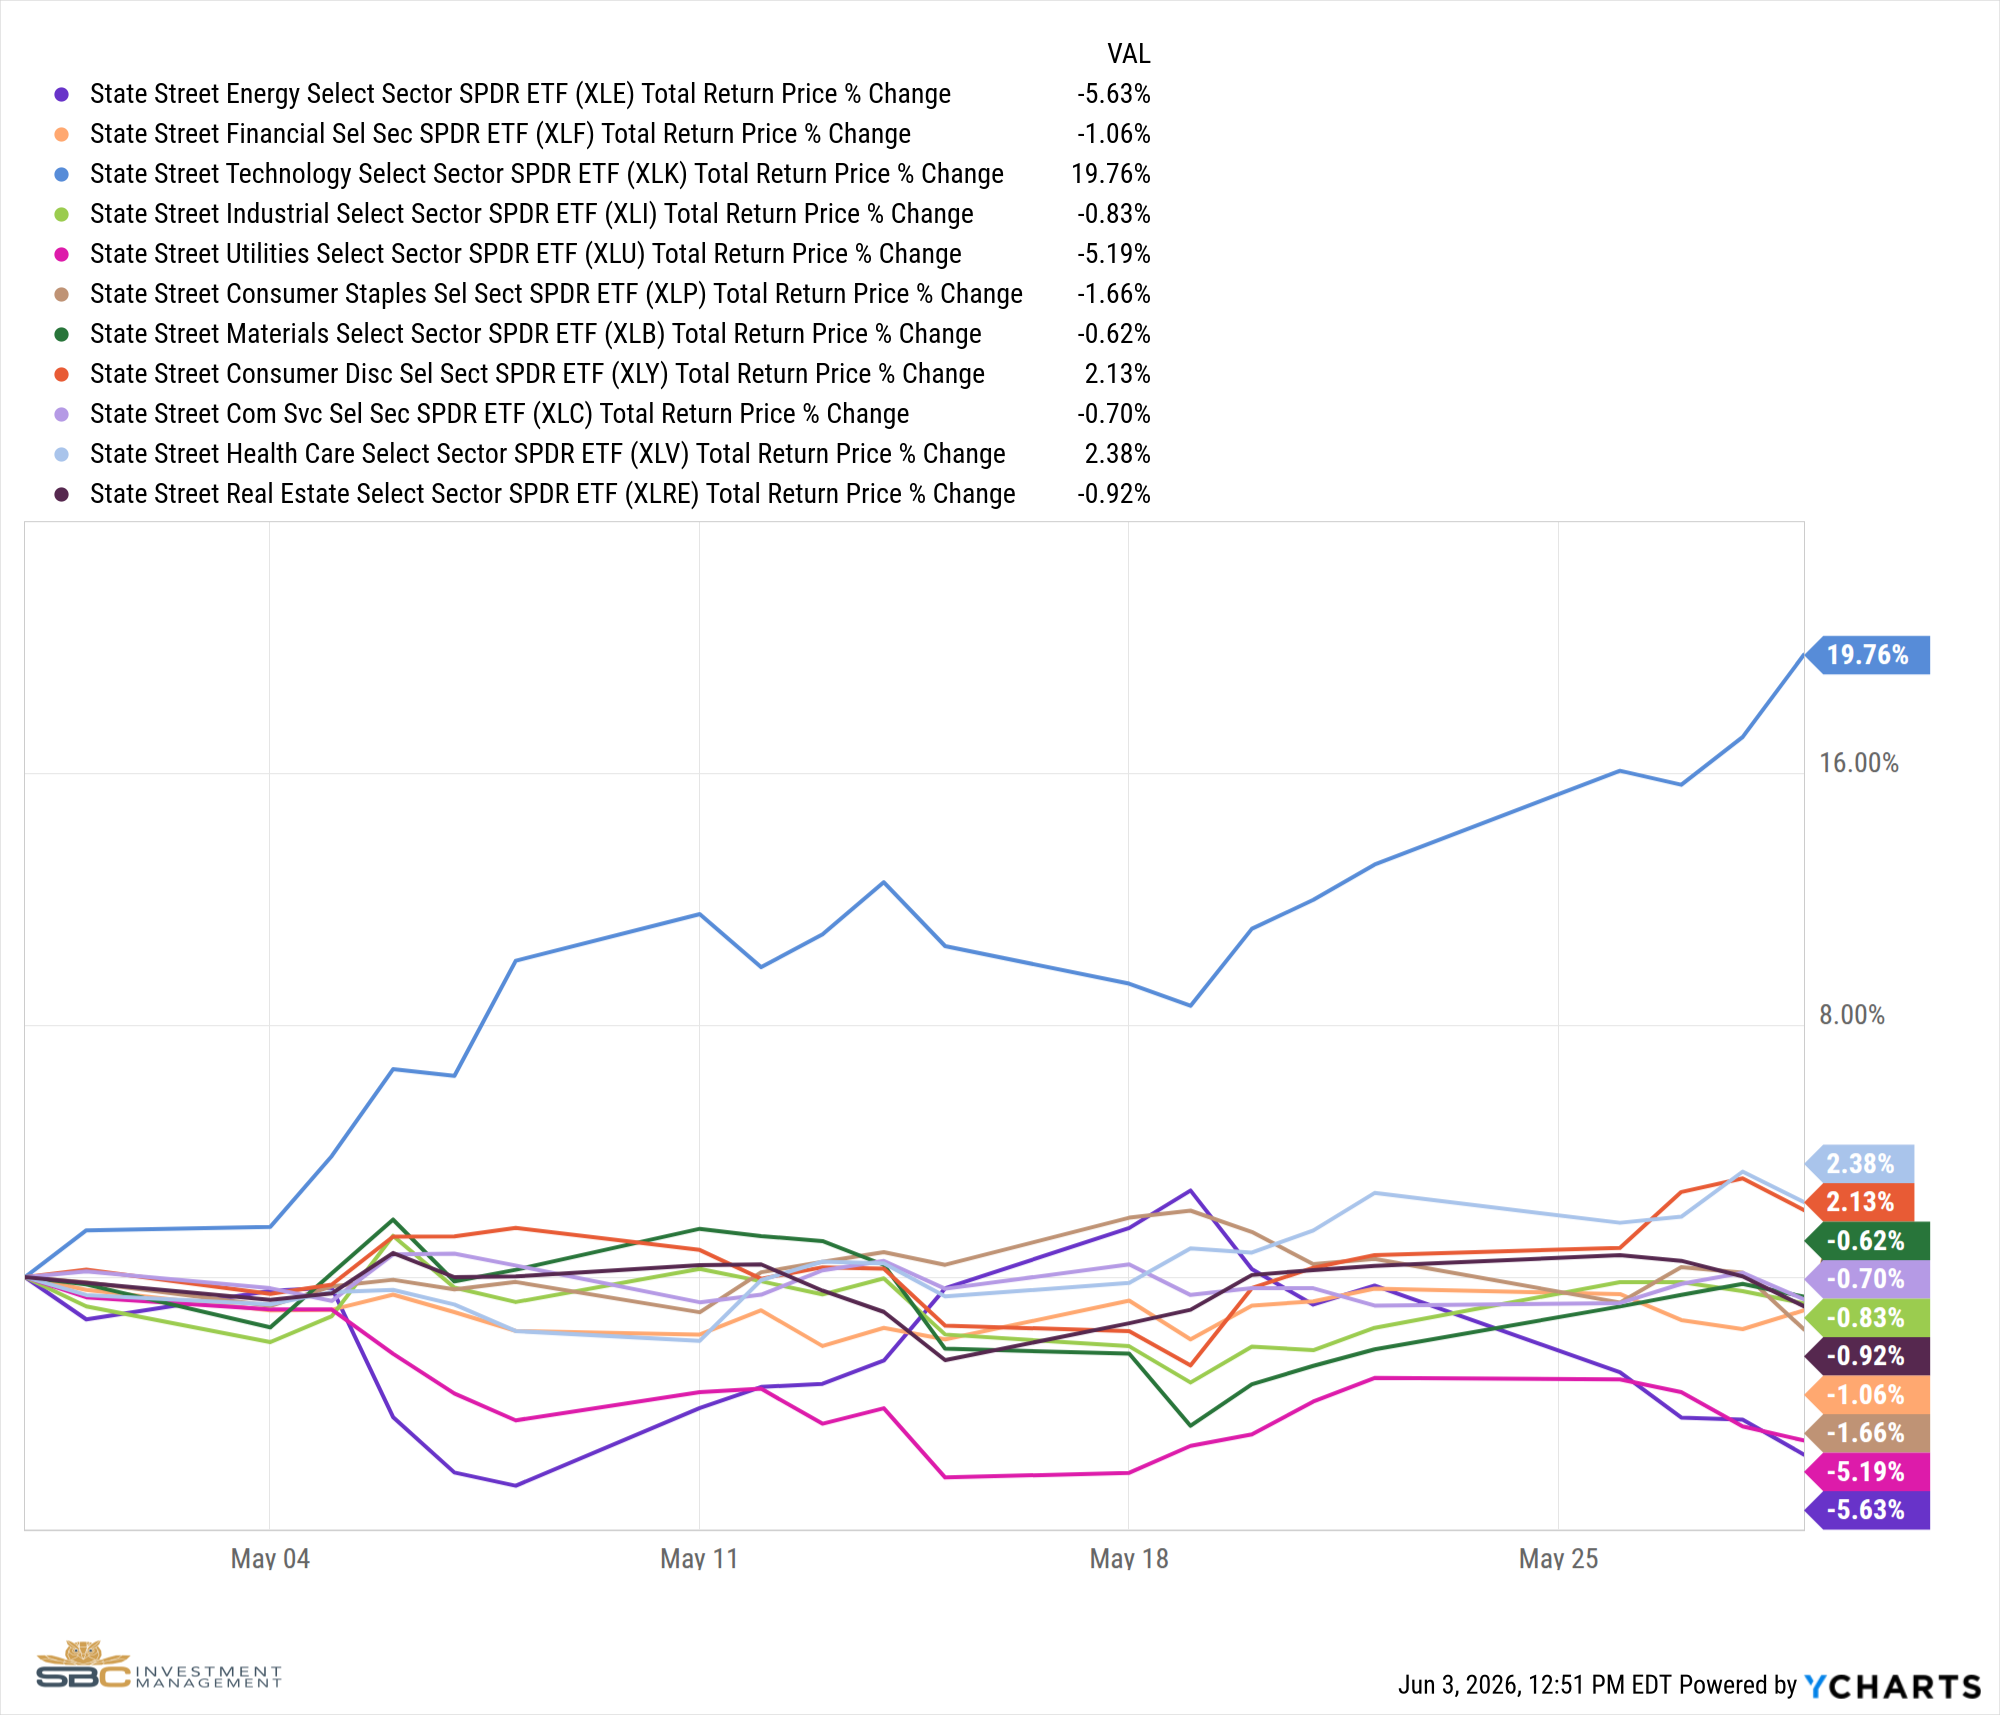
• The S&P 500 gained 5.26% in May, but the story was almost entirely written by one sector: Technology rose 19.76%, its best monthly performance in years.
• NVIDIA reported record quarterly revenue of $81.6 billion, up 85% year over year, and AMD's data center segment grew 57%, confirming that AI infrastructure spending remains the most powerful single demand driver in global equity markets.
• The macro regime remained Quad 2 throughout May, with growth and inflation accelerating simultaneously, providing a constructive backdrop for equities even as rates continued to rise.
• A significant dollar reversal mid-month shifted the cross-asset picture, reducing tailwinds for international equities and commodities while reinforcing the rotation toward domestic secular growth themes.
• We ended the month with new positions in robotics and quantum computing, reflecting our conviction that AI is not a single-quarter trade but a multi-year infrastructure buildout that rewards sustained positioning.
A Month That Belonged to Technology
May 2026 was a lesson in what happens when the most powerful structural theme in the market aligns with a positive macro regime. The S&P 500 returned 5.26% for the month and the Nasdaq returned 8.43%, but those index numbers obscure the real story: the Technology sector gained 19.76% while eight of the remaining ten sectors finished in negative territory. Health Care and Consumer Discretionary each managed modest gains of roughly 2%, but no other sector came close. Energy fell 5.63%, Utilities declined 5.19%, and Financials, Industrials, and Consumer Staples all ended the month in the red. This was not a broad market rally. It was a concentrated advance driven by a single, well-defined theme.
The macro backdrop set the stage. The Hedgeye GIP Model confirmed consecutive monthly Quad 2 readings through May, a regime defined by accelerating growth and accelerating inflation. Quad 2 historically favors equities, commodities, and risk assets broadly, though which parts of the market lead within that regime depends on where the underlying earnings growth is actually coming from. In May, that answer was unambiguous: AI infrastructure spending was the dominant driver of corporate earnings acceleration, and the market priced accordingly.
NVIDIA, AMD, and the AI Infrastructure Machine
The clearest expression of that dynamic arrived on May 20, when NVIDIA reported quarterly revenue of $81.6 billion, up 85% year over year and above Wall Street's estimate of $78.8 billion. Data center revenue alone reached $39.1 billion, up 69% from the prior year, and this marked NVIDIA's 22nd earnings beat in the past 24 quarters [1]. AMD followed with a similarly strong print, reporting data center revenue growth of 57% year over year and guiding next quarter above consensus at $11.2 billion [2].
These numbers matter not just as single-company results but as a read on the entire AI capital spending cycle. The hyperscalers, Microsoft, Google, Amazon, and Meta, have each committed to significant increases in AI infrastructure spending in 2026. NVIDIA and AMD are the primary beneficiaries of that spending. Every dollar that flows into AI training clusters, inference hardware, and data center buildout flows directly into semiconductor demand. What May confirmed is that this cycle has not stalled. It has accelerated.
The semiconductor sector's performance in May reflected exactly that reality. The PHLX Semiconductor Index has now surged over 65% year to date [2], and the gap between technology and every other sector in May was one of the widest readings on record. Out of 500 S&P 500 constituents, 286 ended the month in negative territory [3]. The gains were concentrated, and the concentration had a clear address.
The Cross-Asset Picture: Rates, the Dollar, and a Potential Yield Peak
The rate environment complicated the month's narrative without ultimately derailing it. April CPI accelerated to 3.81% year over year, and the bond market finally priced what the data had been saying for months. The 30-year Treasury yield reached its highest level since 2007 during the week of May 16, and the 2-year and 10-year also printed new cycle highs. The Bloomberg U.S. Aggregate Bond Index returned just 0.31% for the month, a reminder that fixed income remains challenged in an environment where inflation continues to reaccelerate.
The U.S. Dollar added its own wrinkle. After weeks of sustained bearish price action, the DXY broke to the upside in mid-May, gaining 1.4% in a single week and shifting its correlation to the S&P 500 from deeply negative to slightly positive. That reversal carried direct portfolio implications. Dollar weakness had been functioning as the primary transmission mechanism for international equity and commodity outperformance, and as that tailwind faded, so did the case for broad emerging market and foreign equity positioning.
By month end, however, there were early signs that the rate move was exhausting itself. The 10-year Treasury reversed course in the final week of May, rolling back toward the lower end of its risk range and settling at 4.45%. A pattern of lower highs in the 10-year through the final week of the month represents an early signal worth watching. If yields have peaked and the dollar stabilizes, the conditions for equity duration and selective fixed income to contribute meaningfully to portfolios improve considerably heading into summer.
What We Did and Why
The month's positioning decisions reflected a deliberate rotation from cyclical and international exposures toward domestic secular growth. Early in May, we added to small and mid-cap exposure through IWM and VXF, consistent with our view that domestic equities were better positioned than international names as the dollar reversed trend. We exited Mexico, Hong Kong, Turkey, and Argentina, reducing cross-asset risk in positions with elevated currency sensitivity. We also added to regional bank exposure briefly before rotating out of energy as oil's trend signal broke down, which drove our exit of oil exploration exposure at month end.
The most significant portfolio signal of May was the initiation of positions in ROBO (Robotics) and QTUM (Quantum Computing). These are not cyclical trades. They are structural expressions of the same secular theme that drove the technology sector's outperformance. AI is the demand driver for semiconductor hardware, but it is also the enabling technology for robotics and quantum computing applications across manufacturing, logistics, and scientific research. Adding these positions at this stage reflects our conviction that the AI-driven technology cycle has years of runway ahead, not quarters.
Looking Ahead: Earnings Season as the Next Test
The most important near-term catalyst to watch is second-quarter earnings season, which begins in earnest in early July. Q2 was the quarter in which tariffs and supply chain disruptions were most acutely felt across the broader economy, and companies reporting in July will be delivering the first real evidence of how that energy and input cost shock translated into margins and revenue. For sectors that struggled in May, including Energy, Industrials, and Consumer Staples, those reports will either validate continued weakness or provide a re-entry signal. For technology, the question is whether AI capital spending commitments remain intact or show any signs of moderation as CFOs weigh returns against cost.
The AI infrastructure buildout is not a single-quarter story. NVIDIA does not grow 85% year over year because of a favorable macro month. It grows because the world's largest technology companies have concluded that AI capability is a strategic priority worth spending hundreds of billions of dollars to develop. That conviction has not wavered. But after a month in which the technology sector gained nearly 20% while everything else went sideways, the bar for the next earnings cycle is measurably higher. Any disappointment in AI-related guidance would be a more significant catalyst for a pullback than any macro datapoint, simply because so much of the market's performance this year has been priced around that growth story continuing uninterrupted.
We enter June with our conviction in secular growth intact and our positioning aligned accordingly. The earnings data from May confirmed that the fundamentals behind this technology rally are real. Our focus heading into summer is monitoring those fundamentals closely rather than assuming the recent pace of appreciation continues without test. We remain disciplined, process-driven, and attentive to the signals that would prompt us to adjust.
Sources
[1] Nvidia Earnings May 2026: Record $81.6B Revenue and AI Growth Analysis — Intellectia AI
[2] 5 Leading Semiconductor Stocks Dominating May 2026 — Parameter
[3] S&P 500: The Winners and Losers of May 2026 — BBAE
[4] Wall Street Hits Record: AI and Chips Power S&P 500, Nasdaq — HeyGo Trade
[5] May 2026 Economic and Market Update: New Highs and Old Risks — Crestwood Advisors
Model Performance Update
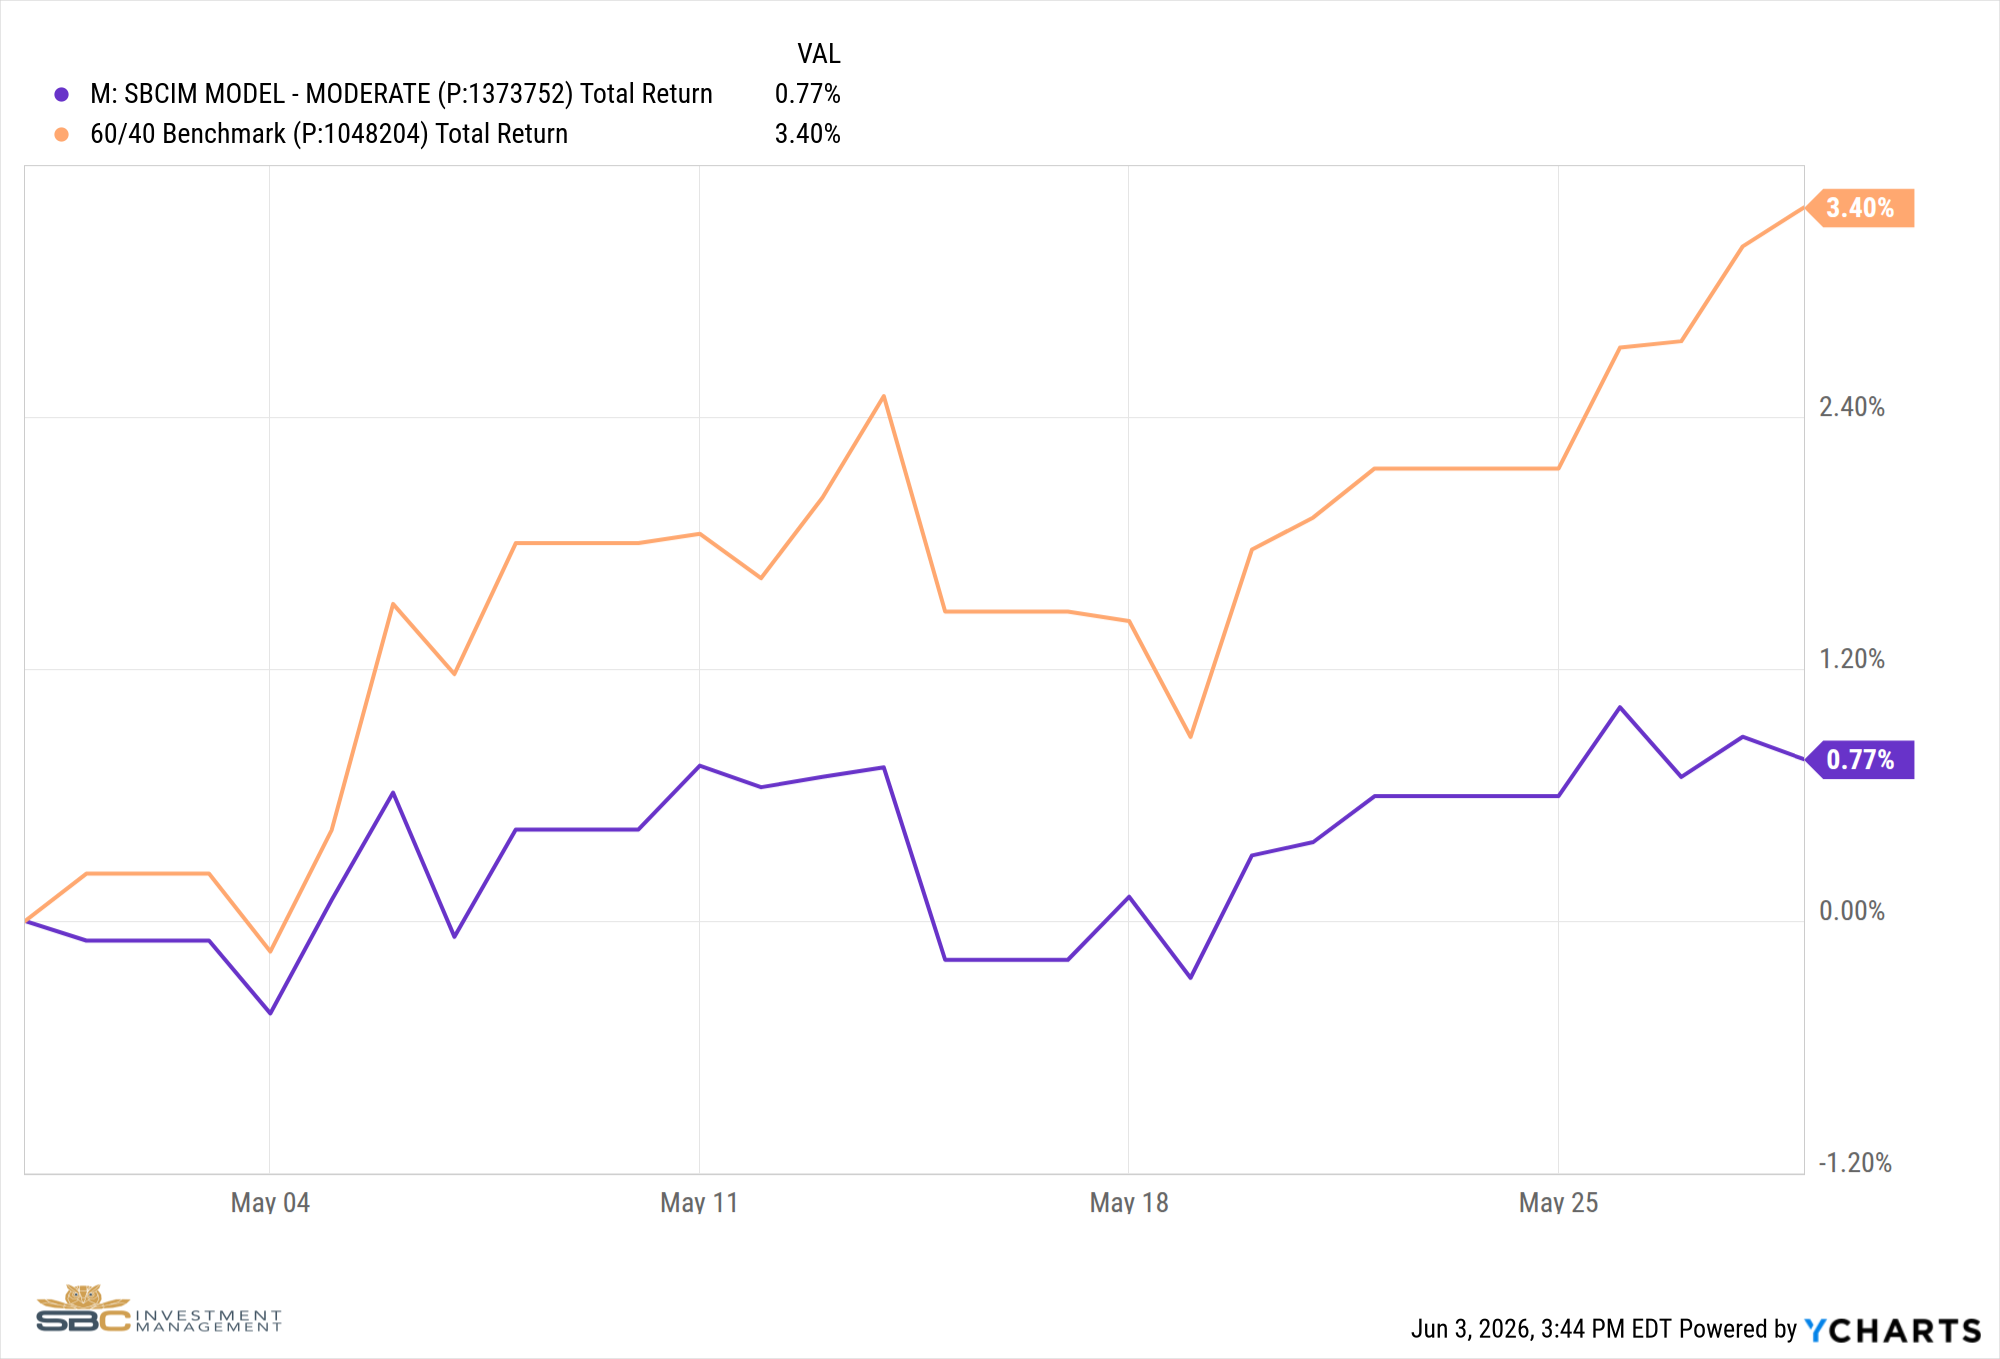
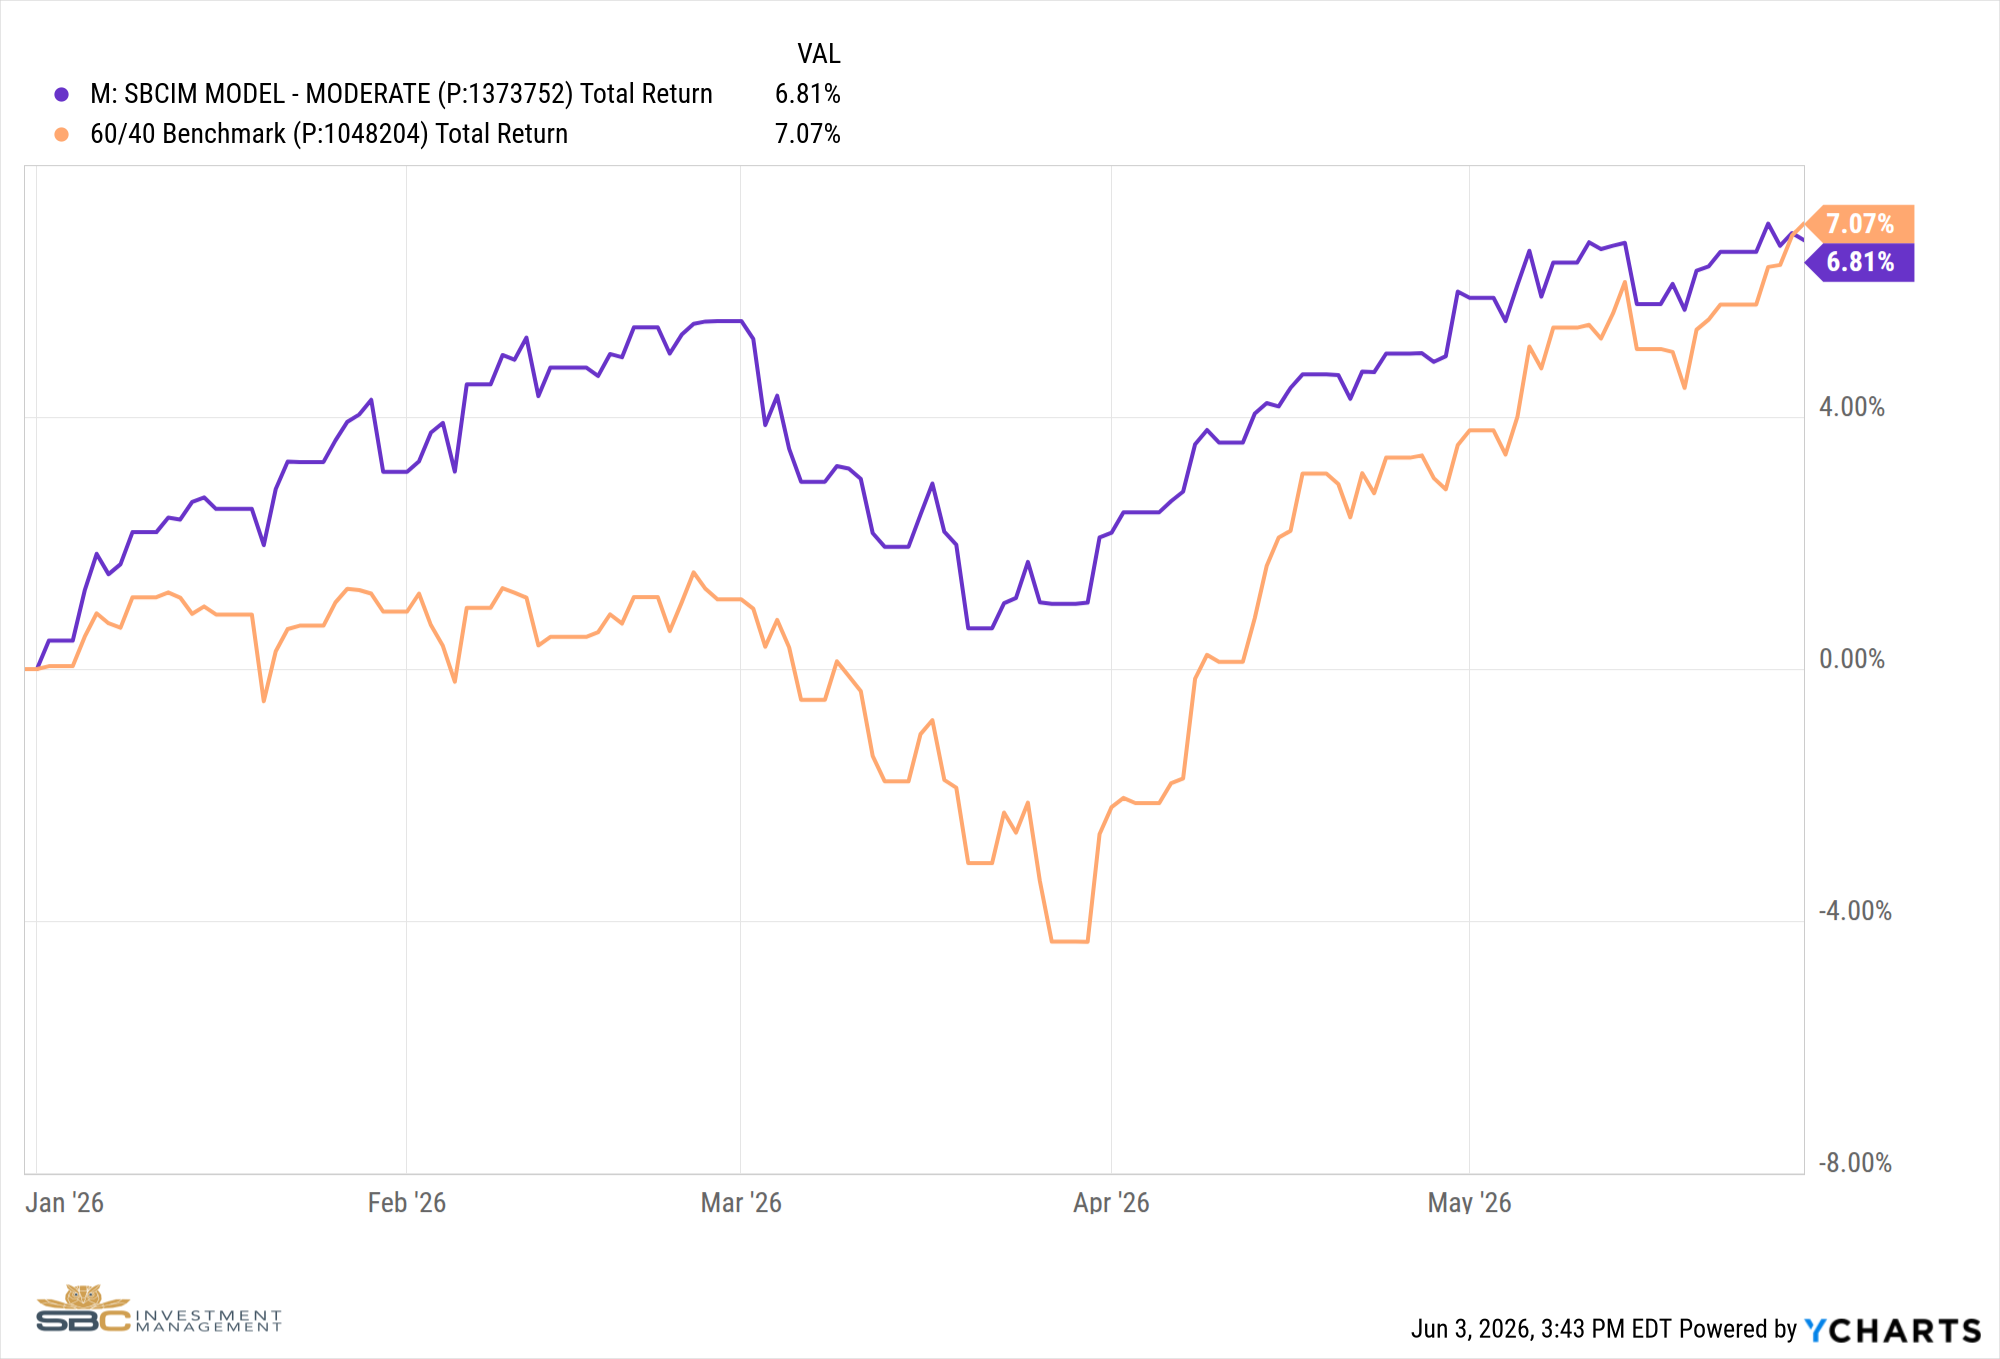
Our Moderate Model Portfolio returned 0.77% in May and has returned 6.81% YTD.
Changes to the model portfolio in May
DATE: 2026-05-05
CHANGE:
– KRE (Regional Banks): Added to Satellite 1
– ARGT (Argentina): Sold from Satellite 1
DATE: 2026-05-11
CHANGE:
– UFO (Space Exploration): Sold from Satellite 1
DATE: 2026-05-12
CHANGE:
– IWM (Small Caps): Added to Satellite 1
DATE: 2026-05-13
CHANGE:
– GII (Global Infrastructure): Removed from Satellite 1
– VXF (Small and Mid Caps): Added to Satellite 1
DATE: 2026-05-19
CHANGE:
– EWW (Mexico), EWH (Hong Kong), TUR (Turkey): Sold from Satellite 1
– IWM (Small Caps), VXF (Small and Mid Caps): Increased in Satellite 1
– ROBO (Robotics), QTUM (Quantum Computing): Initiated in Satellite 1
DATE: 2026-05-26
CHANGE:
– XLI (Industrials): Sold from Satellite 1
– TILL (Agriculture Futures): Initiated in Satellite 3
DATE: 2026-05-29
CHANGE:
– XOP (Oil Exploration): Sold from Satellite 1
– VXF (Small and Mid Caps): Increased in Satellite 1
– UFO (Space Exploration): Re-initiated in Satellite 1
May Performance with Benchmark
YTD Performance with Benchmark
If you have any questions about the above, please reach out to us to set up a one-to-one meeting so we can review your situation.
Sincerely,
Bryant Andrus, MSF, CFP®
President
SBC Investment Management
P: (602) 641-5996 · M: (319) 520-2033 · E: bandrus@sbcinvestmentmanagement.com
Jake Rehkop
Investment Analyst, Junior Portfolio Manager
SBC Investment Management
P: (435) 775-2950 · M: (435) 590-8317 · E: jrehkop@sbcinvestmentmanagement.com