
Earnings season looks backward. Guidance looks ahead.
Key Takeaways
April delivered a sharp equity rebound, leaving little time for active managers to reposition.
Q1 earnings have been strong, as expected. Most of that quarter reflected an economy with solid momentum and relatively stable input costs. Q2 earnings season should provide the first clearer look at how today’s environment is affecting corporate margins.
A weaker US dollar is reinforcing the current market backdrop by supporting multinational earnings, select non-US equities, and commodity linked exposures.
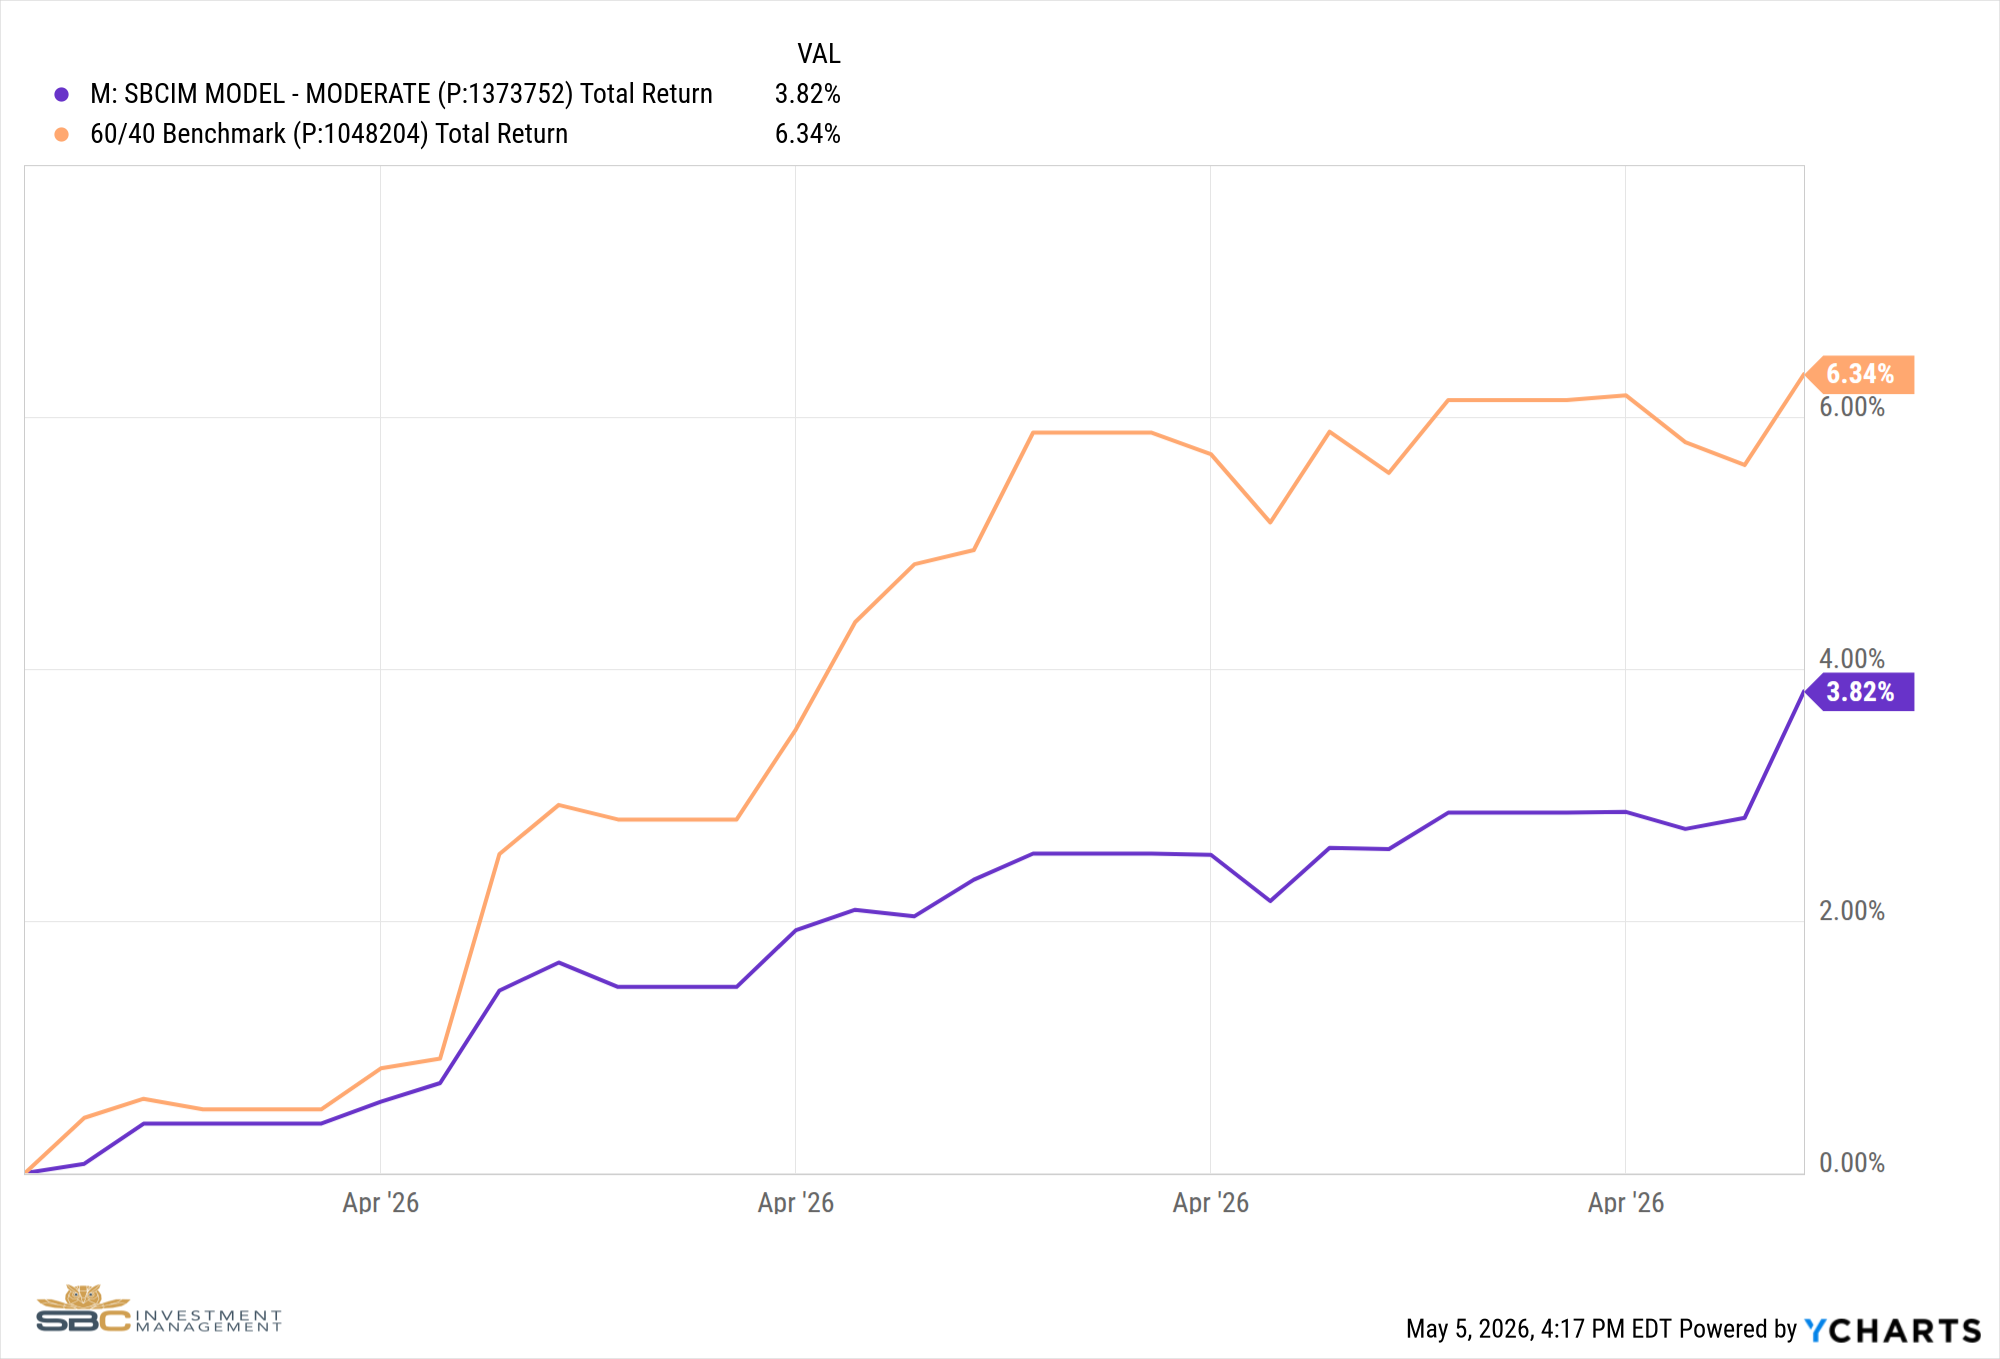
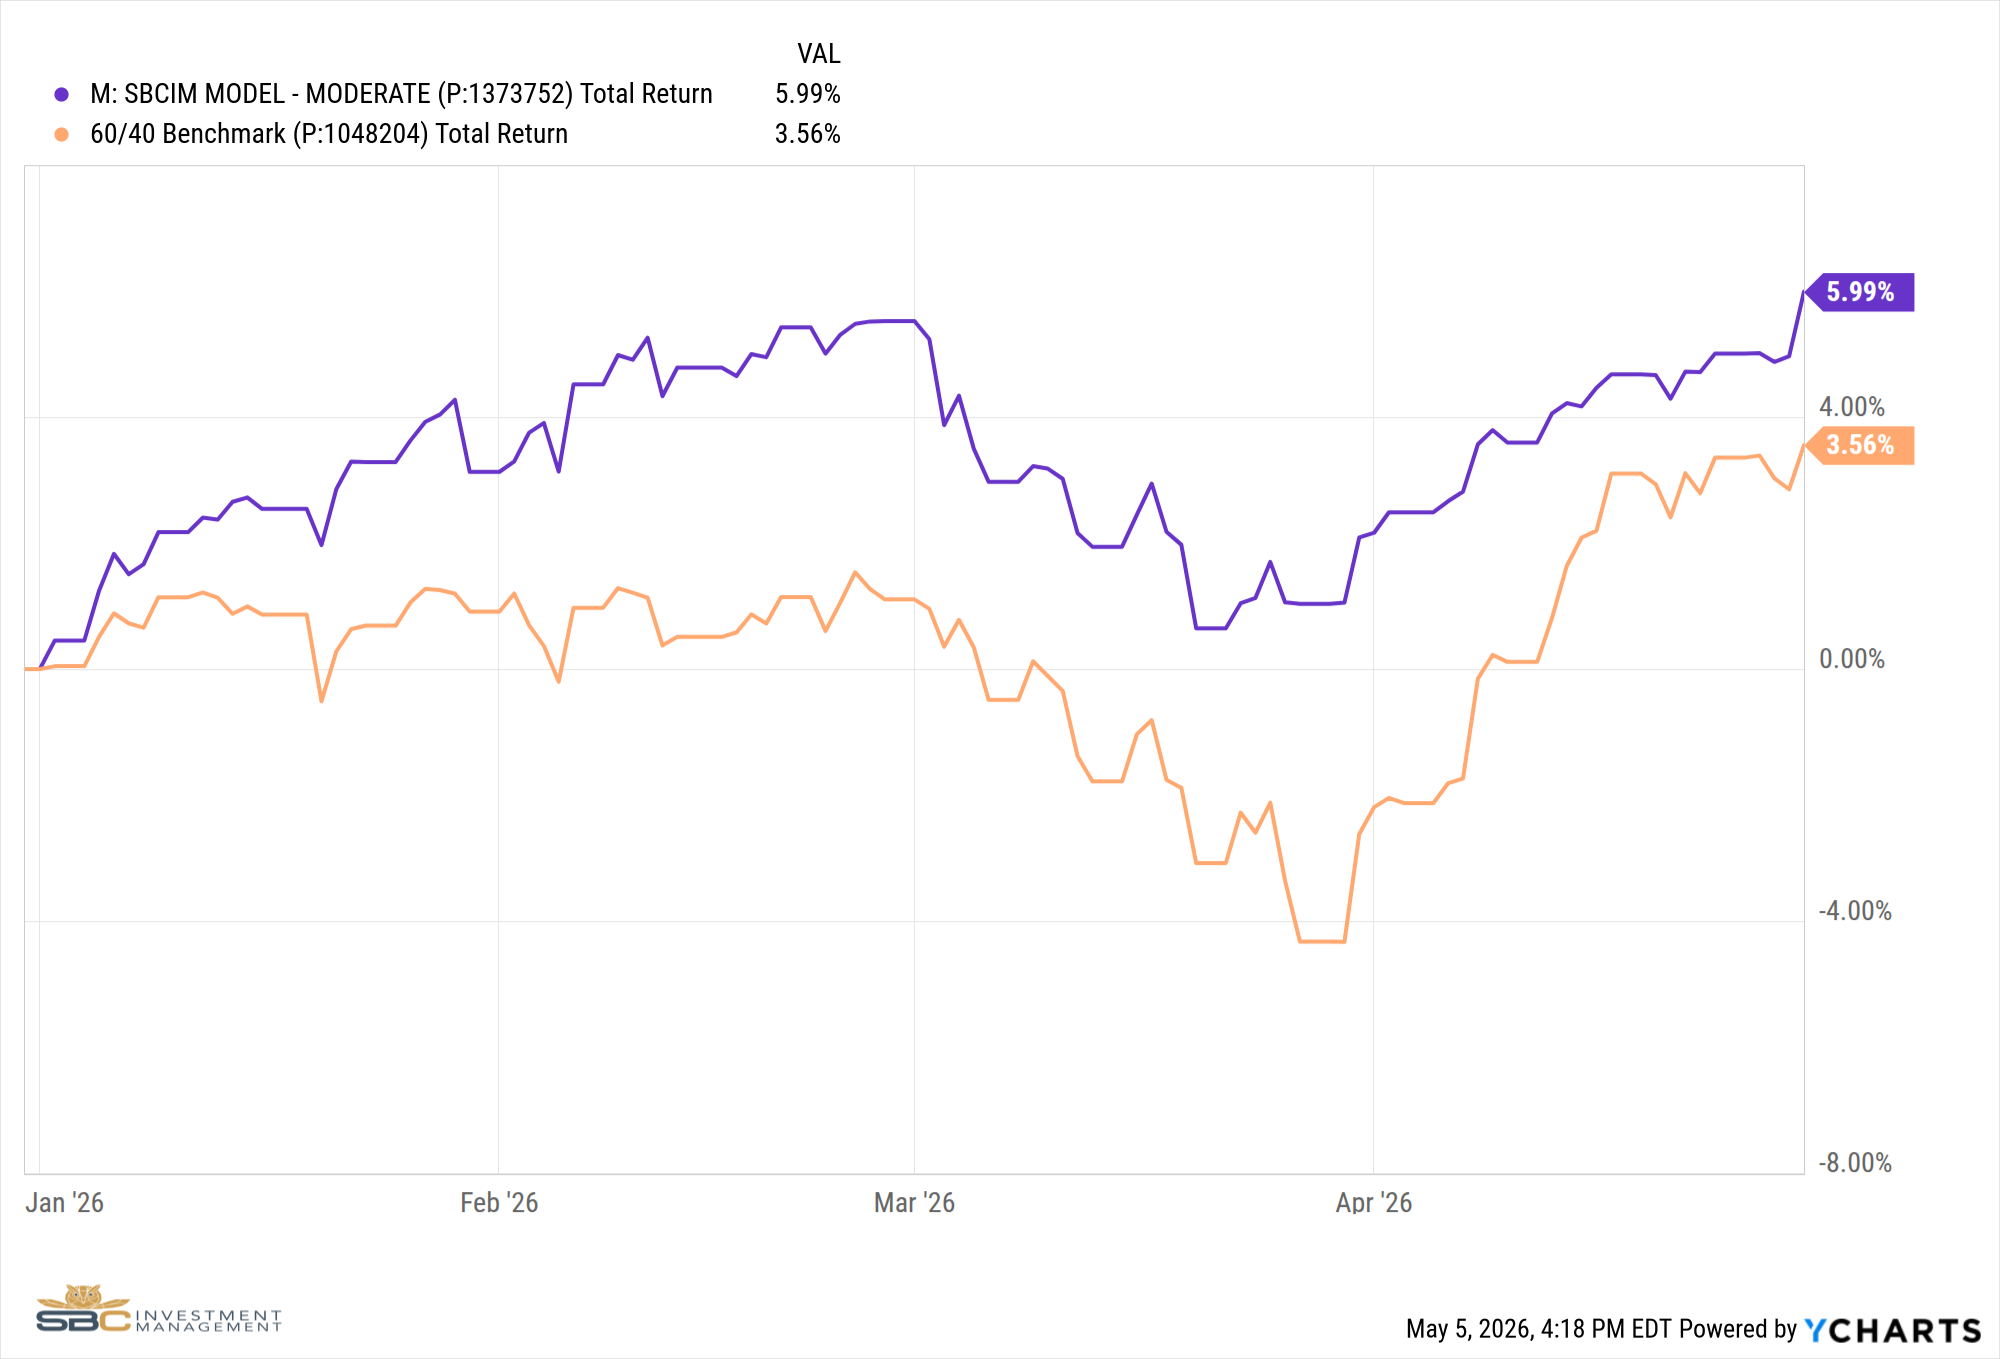
Our Moderate Model returned 3.82% in April and 5.99% year to date through April 30, outperforming our 60/40 benchmark by 243 basis points.
We are participating in the current momentum, but with discipline. Flows remain supportive, signals remain constructive, and we will maintain our positioning until the model tells us otherwise.
April’s Rapid Rebound and Why It Challenged Active Managers
April began with equity markets under pressure. By mid-month, markets had staged a rapid recovery. The S&P 500 gained 3.58% in the week ending April 11 and another 4.55% the following week. The Nasdaq rose 6.84% in that second week alone. Over the course of the month, U.S. large-cap equities erased their losses and moved back toward all-time highs with very little consolidation along the way.

S&P 500 and NASDAQ two week return for period 4/6/26 - 4/17/26
That kind of move creates a specific challenge for active managers. Repositioning takes time. Rotating out of defensive holdings and back into growth exposure usually requires confirmation, but by the time confirmation arrives, much of the move has already occurred. Managers who entered April with a more cautious posture as we did, by design, faced a real trade-off: act before the signal and risk being wrong or wait for confirmation and accept some near-term underperformance. We chose the latter. That discipline can come with a short-term cost, but it is also how long-term outperformance is built.
Why Q1 Earnings Tell Only Part of the Story
Q1 earnings have been historically strong. With 63% of S&P 500 companies reporting, 84% have beaten EPS estimates, above both the five-year average of 78% and the 10-year average of 76%. The blended earnings growth rate stands at 27.1%, which would be the highest since Q4 2021 if it holds. Revenue results have also been strong, with 81% of companies beating estimates. None of this is especially surprising. [2]
The more important point is timing. Q1 covers January through March, and most of that period reflected an economy with relatively stable energy prices, firm consumer demand, and solid underlying momentum. Even where the quarter began to capture geopolitical disruption, it reflected only the initial shock, not the full effect on supply chains, freight costs, input prices, or consumer behavior. Those pressures typically take time to work through the economy. In that sense, Q1 strength tells us more about the recent past than the current operating environment.
Q2 should offer a more meaningful test. For the first time, companies will report against a full quarter shaped by elevated energy prices, dollar weakness, and softer consumer sentiment. That does not guarantee broadly weaker results. Corporate America has remained resilient, and early guidance has held up better than many feared. But Q2 results should provide the first clearer read on what the current environment is actually doing to margins. Investors focused only on Q1 beats may be drawing confidence from data that is already backward-looking. [2][3]
Why the Dollar Is Driving Markets Right Now
One of the most important macro developments in April was the continued decline in the U.S. Dollar Index. The DXY broke below 100 in the middle of the month and remained under pressure through month-end, closing near 98.5. That move had meaningful implications across equities, commodities, and international markets. [4]
Over the long run, the correlation between the DXY and the S&P 500 has been modestly negative. More recently, that inverse relationship appears to have strengthened as dollar weakness has coincided with gains in both equities and commodities. Because a substantial share of S&P 500 revenue is generated outside the United States, a weaker dollar can act as a direct earnings tailwind for multinational companies. That support is already beginning to show up in reported results and could remain in place as long as the dollar stays under pressure. [5][6]
The impact can be even more pronounced internationally, particularly in emerging markets. When the dollar weakens, local currencies often strengthen, the burden of dollar-denominated debt eases, and purchasing power improves. Commodity-exporting economies can benefit on two fronts: stronger export competitiveness and firmer resource prices. That is one reason sustained dollar weakness can support outperformance in select international and emerging-market exposures. [6]
We positioned accordingly. Rather than broadening international exposure indiscriminately, we added selectively in markets where the macro backdrop appeared most favorable given the dollar’s trajectory. Argentina, Canada, Turkey, Norway, Mexico, and Hong Kong each represent a distinct thesis rather than a generic non-U.S. allocation. In an environment marked by wide country-level dispersion, that selectivity matters.
How We’re Positioned Heading Into May
Our monthly signal remains constructive as we enter May. As long as that remains true, our bias toward risk assets stays intact. We are not stepping away from that signal simply because the macro backdrop is complicated. Markets do not move on fundamentals alone; they also respond to flows, momentum, and positioning. Right now, those forces remain supportive. We will continue to participate while the signal holds, and we will adjust when it changes.
What we are watching most closely now is the setup for Q2 earnings season, which begins in July. If companies begin to lower guidance or cite energy prices and consumer weakness as more meaningful headwinds, the market may have to reprice the gap between Q1 strength and current reality. Our objective is not to react late to that shift, but to be prepared for where capital may need to move next.
In fixed income, we remain deliberately short in duration. The Bloomberg U.S. Aggregate declined in both the third and fourth weeks of April as Treasury yields stayed firm or moved higher. The 10-year Treasury ended the month at 4.40%, and the 30-year closed at 4.98%. At current levels, we do not see a compelling reason to extend duration. “Higher for longer” remains the most defensible rates outlook, and our positioning reflects that view. [7]
For investors, this remains an environment that rewards discipline over reaction.
Sources
[1] Hedgeye
[2] FactSet: S&P 500 Earnings Season Update
[3] Yahoo Finance: U.S. Consumer Sentiment
[4] Ferrante Capital Advisers: Dollar Index (DXY)
[5] PortfoliosLab: DXY vs. SPY Correlation
[6] HeyGoTrade: Dollar Index Impact on U.S. Stocks
[7] U.S. Treasury: Interest Rate Data
Portfolio Performance Update
Our Moderate Model Portfolio returned 3.82% in April and 5.99% year to date through April 30. We entered the month with a more defensive posture following March volatility. While that positioning limited participation in April’s rapid rebound, it also helped preserve our year-to-date outperformance of 243 basis points versus the 60/40 benchmark.
Taken together, the portfolio changes made during April increased cyclical and selective international exposure while maintaining a disciplined, short-duration fixed-income stance.
Portfolio Changes in April
April 14, 2026
Added ARGT (Argentina) and GII (Global Infrastructure) in Satellite 1.
April 15, 2026
Shifted 4% cash from Satellite 2 to Satellite 1.
Added XLI (Industrials) and EWH (Hong Kong) to Satellite 1.
April 21, 2026
Sold XLU (Utilities) in Satellite 1.
Increased the XLI (Industrials) position in Satellite 1.
Shifted 2.5% cash from Satellite 1 to Satellite 3.
Added SLV (Silver) and GDX (Gold Miners) in Satellite 3.
April 28, 2026
Sold AMLP (Energy MLPs) in Satellite 1.
Added EWC (Canada), UFO (Space Exploration), and TUR (Turkey) in Satellite 1.
Removed GDX (Gold Miners) and SLV (Silver) from Satellite 3.
Added CPER (Copper) in Satellite 3.
April Performance vs. Benchmark
Year-to-Date Performance vs. Benchmark
If you have questions about any of the above, we would be happy to schedule a one-to-one meeting to review your portfolio and discuss how this environment may affect your financial plan.
Sincerely,
Bryant Andrus, MSF, CFP®
President
SBC Investment Management
P: (602) 641-5996
M: (319) 520-2033
E: bandrus@sbcinvestmentmanagement.com
Jake Rehkop
Investment Analyst, Junior Portfolio Manager
SBC Investment Management
P: (435) 775-2950
M: (435) 590-8317
E: jrehkop@sbcinvestmentmanagement.com