
Reading the Turn
TL;DR
• The defining story of June was a likely peak in U.S. inflation, confirmed by collapsing crude oil, falling long-end Treasury yields, and a bond market that consistently disagreed with the Fed's hawkish signals.
• May's blowout payroll report (172K vs. 88K consensus) ended the S&P 500's nine-week winning streak and repriced the Fed toward rate hikes, but the bond market's behavior over the following three weeks told the more important story.
• When inflation decelerates, the assets that benefit most are long-duration bonds and rate-sensitive equities including High Dividend Yield, Real Estate, Homebuilders, and Utilities. We moved into all of them through June, ahead of what we believe will be a confirming CPI print.
• June closed with the Nasdaq falling more than 4% in a single week as mega-cap technology sold off and money rotated into defensives and fixed income, confirming the repositioning was well-timed.
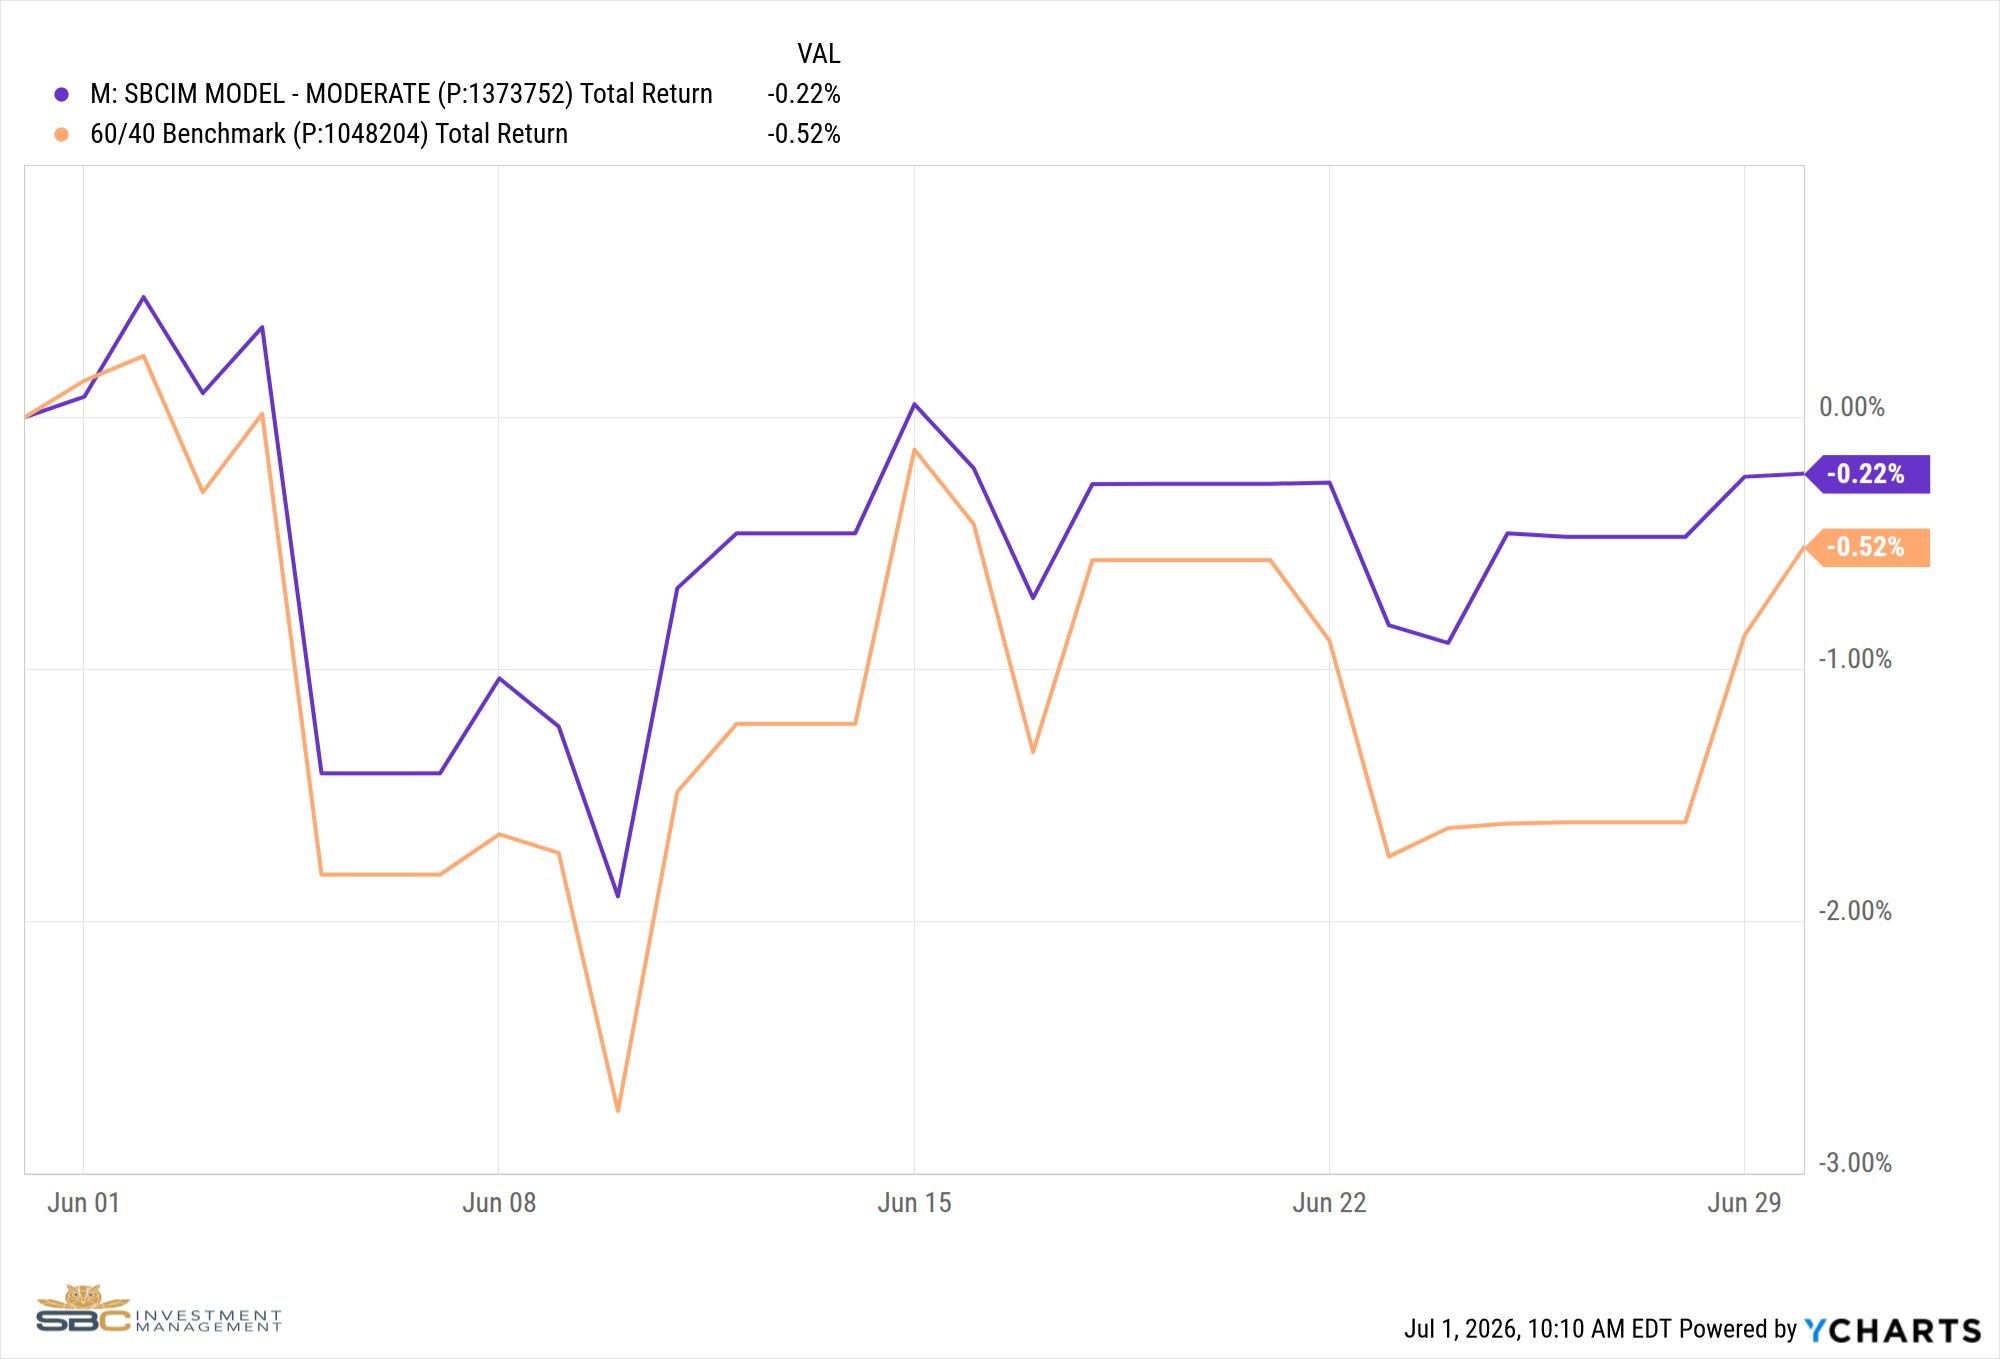
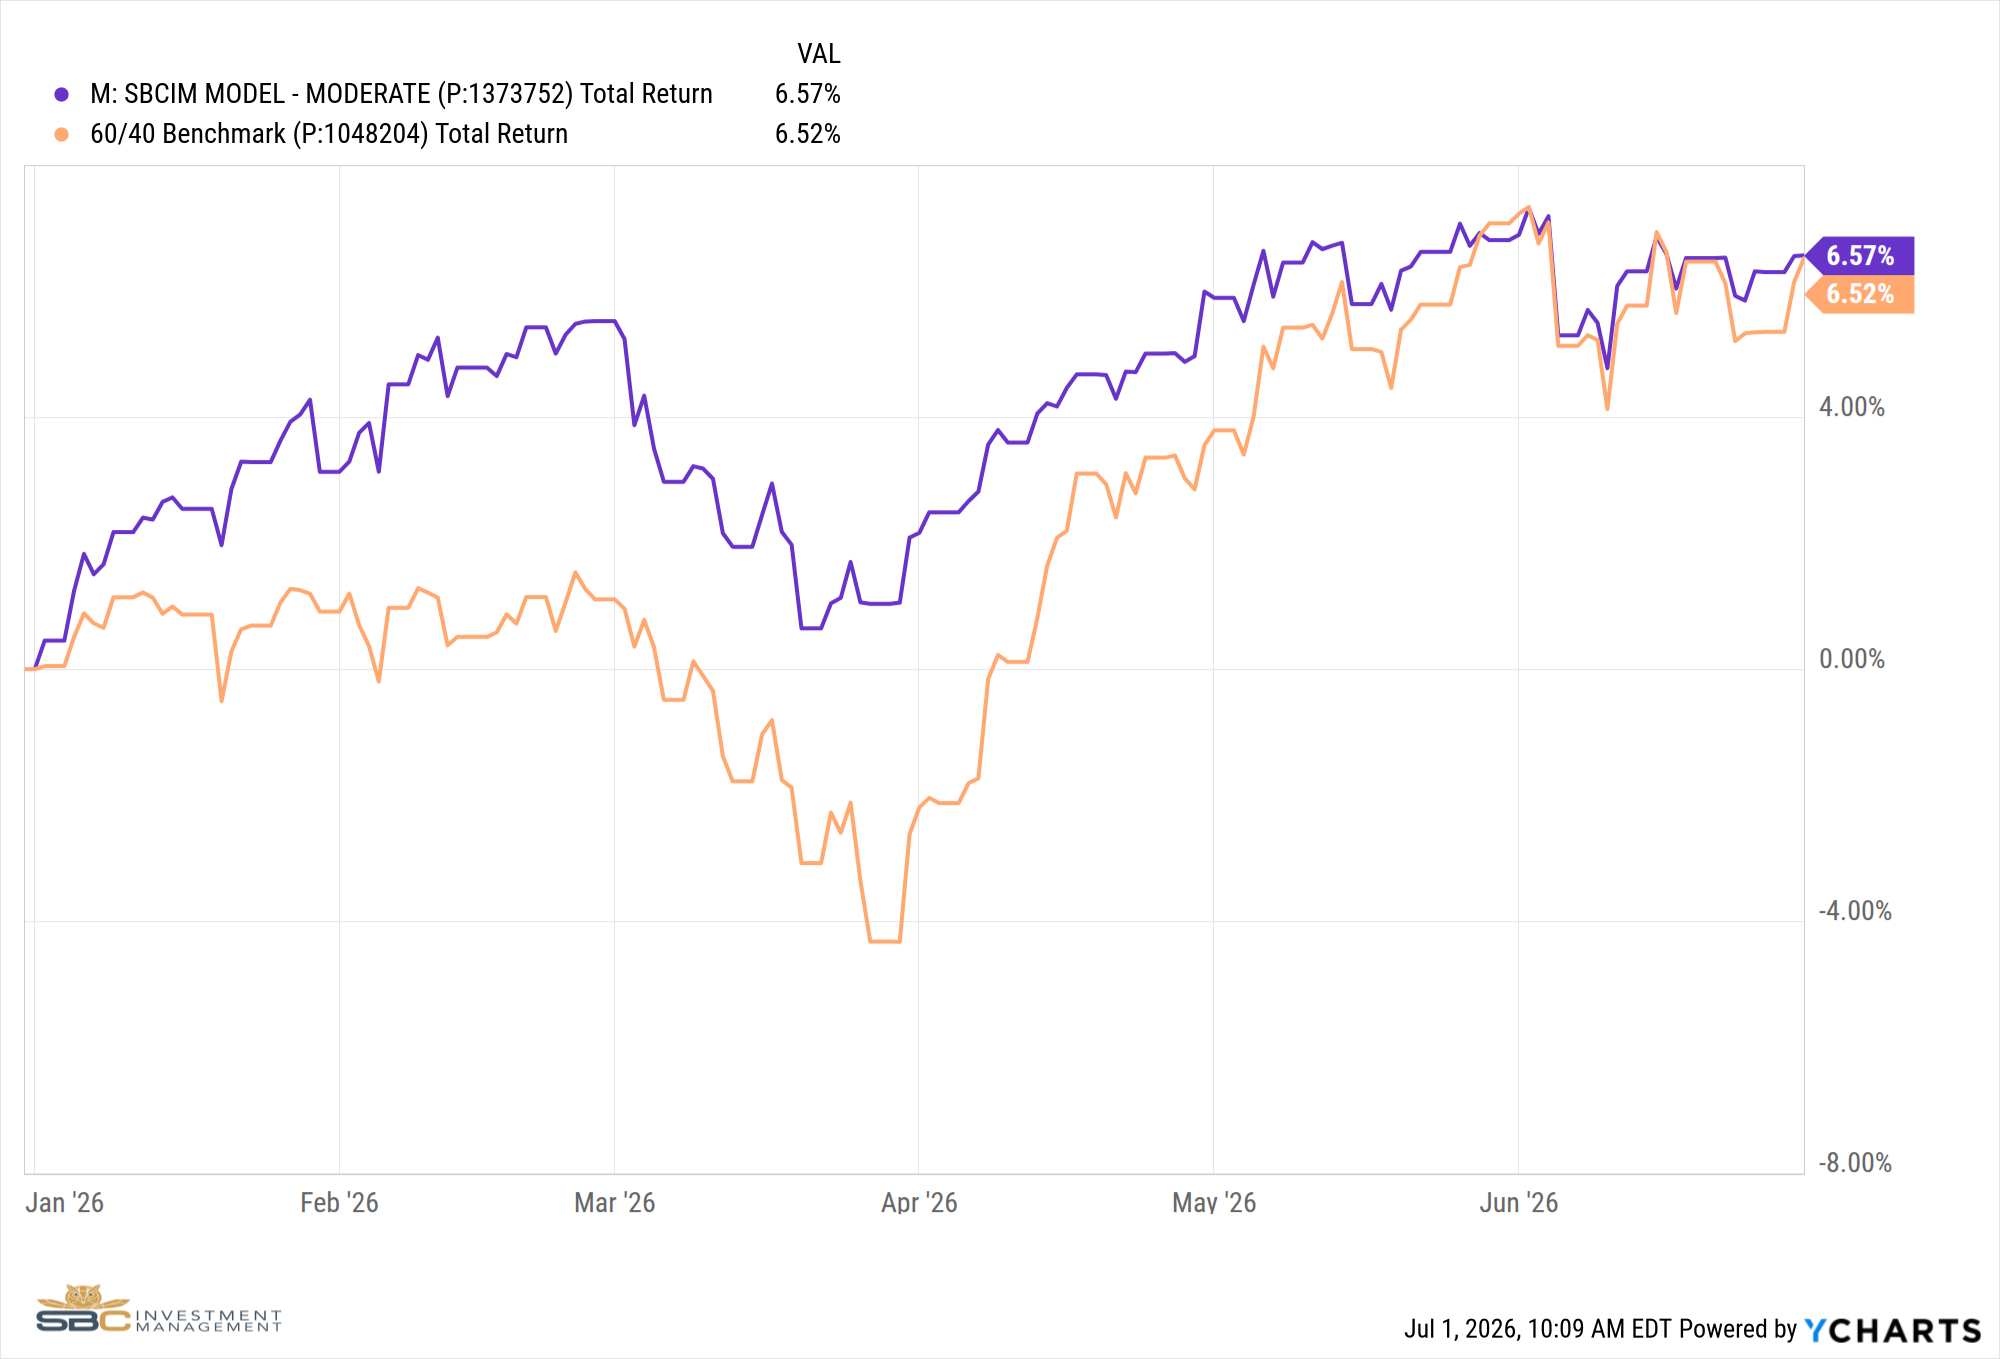
• The SBCIM model finished June at -0.22% versus the benchmark's -0.52%. Year-to-date, the portfolio stands at +6.57% versus the benchmark's +6.52%.
June in Brief
June was a month with four distinct personalities. It opened with a payroll shock that ended the S&P 500's nine-consecutive-week winning streak. The second week brought geopolitical volatility as Iran war headlines moved markets in both directions before a ceasefire sparked a sharp recovery. The third week saw the Federal Reserve hold rates while the bond market quietly disagreed with every word of the press conference. And the fourth week delivered an unambiguous rotation: the Nasdaq fell more than 4% while defensives, bonds, and small caps held firm. Taken individually, each of those weeks told a different story. Taken together, they told one.
The May nonfarm payrolls report, released on the first Friday of June, set the tone early. The economy added 172,000 jobs against an 88,000 consensus estimate, [1] nearly double what the market had priced in, with prior months revised higher as well. It may seem counterintuitive that a strong jobs number would send markets sharply lower, but the logic is straightforward. A healthy labor market means the Federal Reserve has little reason to cut rates and every reason to hold them higher for longer. At its extreme, strong data gives the Fed cover to hike further, increasing the cost of capital across the economy and compressing valuations on growth stocks, pressuring existing bondholders, and making cash and short-duration instruments more attractive relative to risk assets. When a number like that lands and the market has been leaning toward easier policy, the unwind is mechanical and fast. The S&P 500 dropped -2.55% on the week, the Nasdaq fell -4.65%, and the VIX surged from below 16 to above 21 in a single session.
The Story Underneath: Inflation Has Likely Peaked
What happened after that payroll shock is the more important story. Over the following three weeks, the bond market sent a message that contradicted almost everything the Federal Reserve was saying. The Fed met on June 18 and held rates steady, but signaled markets should expect up to 1.5 additional hikes by year-end. That language should have kept bond yields elevated and pressured equities. Instead, the 10-year and 30-year Treasury yields continued to fall. Breakeven inflation expectations dropped sharply across timeframes. Options markets flagged the June quarterly expiration, the largest on record at roughly $5.15 trillion in notional SPX exposure, as a source of technical noise, but the directional message from the bond market was unmistakable: the cycle high for inflation is likely in. [2]
Crude oil confirmed what the bond market was signaling. Brent crude collapsed from its April high of approximately $118 per barrel to roughly $76 per barrel by mid-June, [3] one of the sharpest commodity drawdowns of the year and one of the most reliable leading indicators for where consumer prices are headed. Energy costs flow through to CPI with a lag of a few months, meaning the prints we receive over July and August should begin to reflect that collapse. The bond market already knows this, which is why it rallied into a hawkish Fed rather than selling off. When the long end of the curve moves in the opposite direction of the Fed's guidance, that is the bond market calling the Fed's bluff, and historically the bond market tends to be right.
What Disinflation Means for Markets
When inflation decelerates, the landscape for financial assets shifts in predictable ways. Long-duration bonds benefit directly: as inflation expectations fall, the real return on existing bonds improves and prices rise. Rate-sensitive equities respond in kind. Real estate, homebuilders, utilities, and healthcare all carry bond-like characteristics, with cash flows that are relatively stable and valuations sensitive to the level of interest rates. As yields fall, these sectors become more attractive on both a relative and absolute basis. Conversely, the sectors that performed best when inflation was rising, including energy, commodities, and the cyclical momentum names that benefited from reflationary positioning, face headwinds as the regime changes.
Mega-cap technology is a more nuanced case. The AI earnings story remains real, and those companies are not simply inflation plays. But after running as hard as they did through May, the repricing of rate expectations creates a mechanical headwind: when the risk-free rate is expected to rise, the present value of future earnings declines, and that math hits long-duration growth names first. The final week's selloff in the Nasdaq was not a repudiation of the AI thesis. It was the market adjusting the discount rate.
How We Positioned Ahead of It
We did not wait for the CPI print to confirm what the bond market and crude oil were already showing. Beginning in the second week of June, as the 10-year yield put in a sequence of lower highs, we began actively repositioning the portfolio toward the disinflation setup.
On June 10th, we made a significant reallocation: exiting Oil Services, Telecoms, Robotics, and Small Caps, and rotating into Healthcare, High Dividend Equity, Aerospace and Defense, and Computer Memory. In Satellite 2, we swapped High Yield Bonds for 10-Year Treasuries, moving duration from a short position to a long one. Over the following weeks, we continued layering in Healthcare exposure through multiple positions, added Real Estate, Homebuilders, Insurance, and Utilities, reduced commodities entirely, and increased our US Dollar position. By the time the final week's technology selloff arrived, the portfolio had already been repositioned to benefit from exactly that outcome.
June required 17 distinct trade actions across the portfolio, which is more than a typical month by a wide margin. That level of activity was not a reaction to volatility, but a response to the data changing and demanding a corresponding change in positioning. If there is one consistent lesson the market has delivered since 2025, it is that regimes shift faster than they used to. Under the current administration and in this macro environment, the market does not wait for consensus to catch up. We try to move when the data moves.
The SBCIM model finished June at -0.22%, outperforming the 60/40 benchmark at -0.52% for the month. Year-to-date, the portfolio stands at +6.57% versus the benchmark's +6.52%.
Looking Ahead: Watching the Data Follow the Signal
The next major development to watch is the June CPI print, due in July, followed by July's print in August. If crude oil staying near $76 per barrel begins to flow through into the reported inflation numbers, as the leading indicators suggest it should, the conversation about Federal Reserve policy will shift. The question will move from how many more hikes to when the discussion about cuts begins. That is a very different environment for financial assets, and one our portfolio is positioned to benefit from.
Q2 earnings season begins in mid-July and adds a layer of complexity. Companies reporting this cycle will be reflecting a quarter that included the early tariff shock and supply chain disruption from spring. Results will be measured not only against analyst estimates, but against a strong prior-year comparable period, meaning the rate of change matters as much as the absolute level. Markets have largely priced in continued AI-driven earnings growth, and those expectations will face a real-world test. We enter earnings season with a more defensive posture than where we started June, and we believe the data supports that positioning. If the disinflation thesis plays out as the bond market is suggesting, the rate-sensitive assets we have been building should continue to perform. If earnings disappoint against elevated expectations, the defensive tilt provides a degree of insulation. We believe we are well-positioned for either outcome.
Portfolio Changes — June 2026
6/2/2026
• Swapped TILL (Agriculture Commodities) for UUP (US Dollar) in Satellite 3
• Swapped JIRE (International Equity) for FENI (Enhanced Large Cap Core) in Core Equity
6/10/2026
• Sold OIH (Oil Services), XTL (Telecoms), NORW (Norway), IWM (Small Caps), ROBO (Robotics), and EWC (Canada) in Satellite 1
• Bought XAR (Aerospace and Defense), VYM (High Dividend Equity), BUG (Cybersecurity), and DRAM (Computer Memory) in Satellite 1
• Swapped HYG (High Yield Bonds) for XTEN (10-Year Treasury) in Satellite 2
• Added PINK (Healthcare) in Satellite 1
6/15/2026
• Added FXH (Healthcare) in Satellite 1
• Reduced COM (Commodities) in Satellite 3
• Added to UUP (US Dollar) in Satellite 3
6/17/2026
• Added XLV (Healthcare) and XLRE (Real Estate) in Satellite 1
6/22/2026
• Added IAK (Insurance) and ARGT (Argentina) in Satellite 1
6/23/2026
• Added XHB (Homebuilders) in Satellite 1
• Removed COM (Commodities) and CPER (Copper) from Satellite 3
6/24/2026
• Moved cash from Satellite 3 to Satellite 1
• Bought VWMI (International High Dividend) and DBJP (Japan) in Satellite 1
6/29/2026
• Sold QTUM (Quantum Computing), BUG (Cybersecurity), ARGT (Argentina), and PINK (Healthcare) in Satellite 1
6/30/2026
• Added XLU (Utilities) in Satellite 1
Sources
[1] U.S. Bureau of Labor Statistics — Nonfarm Payrolls, May 2026
[2] Federal Reserve — FOMC Statement, June 18, 2026
[3] Bloomberg Markets — Brent Crude Oil, June 2026
June Monthly Returns vs. Benchmark
YTD Returns through June vs. Benchmark
If you have any questions about the above, please reach out to us to set up a one-to-one meeting so we can review your situation.
Sincerely,
Bryant Andrus, MSF, CFP®
President
SBC Investment Management
P: (602) 641-5996 · M: (319) 520-2033 · E: bandrus@sbcinvestmentmanagement.com
Jake Rehkop
Investment Analyst, Junior Portfolio Manager
SBC Investment Management
P: (435) 775-2950 · M: (435) 590-8317 · E: jrehkop@sbcinvestmentmanagement.com