
Navigating 2025: Risk-Adjusted Returns in a Volatile Market
2025 Market Review: Resilience Through Volatility
2025 marked the third consecutive year of strong US equity market returns, with the S&P 500 delivering 16.4% in 2025, following gains of 23.31% in 2024 and 24.23% in 2023. [1] However, the path to these returns proved far from linear, as investors navigated a severe correction before witnessing a powerful recovery that tested both strategy and resolve.
The April Correction: A 20% Drawdown
The defining characteristic of 2025 was not simply its positive return, but how those returns were achieved. In April, the S&P 500 fell more than 20% from its highs, briefly entering bear market territory and marking the deepest drawdown since 2022. This correction was triggered by escalating trade policy uncertainty and tariff concerns affecting various supply chains.
The uncertainty created multiple pressure points: rising input costs for manufacturers, semiconductor supply chain disruption fears, retaliatory trade measures threatening U.S. exports, inflation concerns that could derail Federal Reserve rate cuts, and global growth slowdown risks. With potential tariffs threatening to reignite inflation just as the Fed had begun its rate-cutting cycle, policymakers found themselves caught between supporting growth and maintaining price stability.
As the correction deepened, investor psychology shifted dramatically. The speed and severity, 20% in a matter of weeks, triggered widespread risk aversion. Leveraged positions unwound, systematic strategies deleveraged, and investors faced the psychological challenge of substantial portfolio declines. The correction served as a stark reminder of the asymmetric nature of losses: while markets had gained steadily through late 2024 and early 2025, those gains evaporated rapidly.
The Turning Point: Policy Clarity as Catalyst
Markets recovered when Congress passed comprehensive fiscal legislation, the "One Big Beautiful Bill", providing much-needed policy clarity and pro-growth stimulus. The legislation included substantial corporate and individual tax cuts that directly boosted S&P 500 earnings projections, enabled increased capital allocation, and supported consumer spending through individual tax relief.
Critically, the bill included targeted AI infrastructure investment incentives: tax credits for data center construction, accelerated depreciation for AI computing hardware, R&D incentives for AI technology development, and streamlined permitting. [8] This policy support validated the AI investment thesis that had driven markets earlier in the year, providing a fundamental catalyst for technology sector recovery.
Concurrent with fiscal stimulus, the administration stepped back from aggressive tariff proposals. While some tariffs were implemented, the final framework proved more measured: exemptions for critical technology inputs (particularly semiconductors), phased implementation allowing supply chain adaptation, bilateral negotiations reducing retaliatory risks, and strategic sector focus rather than broad-based tariffs.
With trade policy clarity and moderating inflation concerns, the Federal Reserve resumed its accommodative stance, continuing rate cuts that had paused during the uncertainty.
Secular Drivers: AI and Corporate Earnings
Despite April's volatility, artificial intelligence remained the single most powerful secular driver of market performance. "The potential of, and demand for, AI technology were among the key drivers of stock market gains in 2025." [2]
Underlying the market's recovery was robust corporate profitability. Despite mid-year volatility, analysts expected S&P 500 earnings growth of approximately 12% for 2025, with estimated net profit margins reaching 12.9%, well above the 10-year average of 11.0%. [3] Critically, earnings estimates held firm during and after the April correction, suggesting fundamental business performance remained strong despite market turbulence.
Portfolio Performance: Risk Management in Practice
Regardless of experience or tenure in the markets, significant portfolio drawdowns test every investor's resolve. As corrections deepen, news headlines turn increasingly bearish, and a familiar question emerges: "Will this time be different?" The psychological reality is that watching wealth decline rapidly over weeks triggers innate human responses, even the most disciplined investors feel the pull of panic. This emotional strain can drive irrational decisions at precisely the wrong moments.
This is why we employ our core-satellite approach: blending strategic diversification with tactical positioning to deliver enhanced risk-adjusted returns over full market cycles. By combining the stability of a diversified core with the flexibility of actively managed satellites, we aim to protect capital during stress while capturing upside during recoveries, addressing both the mathematics and psychology of drawdown management.
The results of this approach are evident when compared to traditional portfolio construction.
Benchmark Disclosure: Our performance is measured against a 60/40 benchmark (60% S&P 500 / 40% Bloomberg U.S. Aggregate Bond Index), the standard balanced portfolio allocation. Unlike this static benchmark, our core-satellite strategy employs global diversification and tactical positioning that adjusts to changing market conditions, providing the flexibility that proved valuable during 2025's volatile environment.
Performance Comparison

Risk-Adjusted Performance: The Complete Picture
While beating the benchmark on an absolute basis is gratifying, risk-adjusted performance tells the more important story. Our Sharpe ratio of 1.792 significantly exceeded 60/40’s 1.02, indicating enhanced returns per unit of risk taken. We didn't just outperform, we did so while taking less risk and experiencing smaller drawdowns.
The Sortino ratio, a variation of the Sharpe ratio that focuses specifically on downside risk, shows an even more compelling picture at 2.672 versus the benchmark's 1.514. This metric confirms what our clients experienced: less pain during April's correction and smoother overall returns throughout the year.
Maximum drawdown measures the largest peak-to-trough decline. In 2025, the 60/40’s -11.18% April correction versus our portfolio's -7.8%. This metric is critical for understanding worst-case experience and key to evaluating capital preservation. Unlike volatility measures capturing all fluctuations, maximum drawdown focuses specifically on losses, what behavioral finance research shows investors experience most acutely.
Understanding Risk-Adjusted Performance
These metrics separate skilled portfolio management from simple market exposure, revealing not just what we achieved but the quality of how returns were delivered. Below is more depth on each metric, with educational resources to help understand their importance in evaluating portfolio management.
The Sharpe Ratio: Return Per Unit of Risk
Developed by Nobel laureate William Sharpe, the Sharpe ratio is "the most widely used method for measuring risk-adjusted relative returns." The formula divides excess return (above the risk-free rate) by portfolio volatility, measuring return earned per unit of risk taken.
"The Sharpe ratio combines the time weighted returns and volatility to provide a risk-adjusted measure of portfolio performance." [4] Two portfolios might both return 15%, but the one achieving it with half the volatility delivers greater risk-adjusted performance. Our 1.792 Sharpe ratio versus the benchmark's 1.02 demonstrates we delivered more return per unit of volatility, the fundamental measure of investment skill.
The Sortino Ratio: Isolating Downside Risk
The Sortino ratio refines the Sharpe ratio by penalizing only downside volatility. "The Sortino ratio is a variation of the Sharpe ratio that differentiates harmful volatility from total overall volatility by using downside deviation instead of standard deviation." This distinction matters because investors don't mind upside volatility, they mind losses. The Sortino ratio recognizes this asymmetry and is "better for investors primarily concerned with losses." [5] Our Sortino ratio of 2.672 versus the benchmark's 1.514 demonstrates that outperformance came specifically from protecting the downside during April's correction while capturing upside during the recovery.
The Mathematics of Drawdowns
One of the most fundamental, yet frequently misunderstood, concepts in portfolio management is the asymmetric mathematics of losses and gains. Consider the S&P 500's 20% April correction. Many investors assume that a 20% gain will recover a 20% loss. This is mathematically incorrect.
If a portfolio declines 20% from $100,000 to $80,000, it requires a 25% return on that $80,000 to reach breakeven, not 20%. The smaller base demands a proportionally larger percentage gain to recover. As drawdowns deepen, the required recovery gain grows exponentially, making capital preservation during corrections increasingly critical.
Drawdown Recovery Requirements
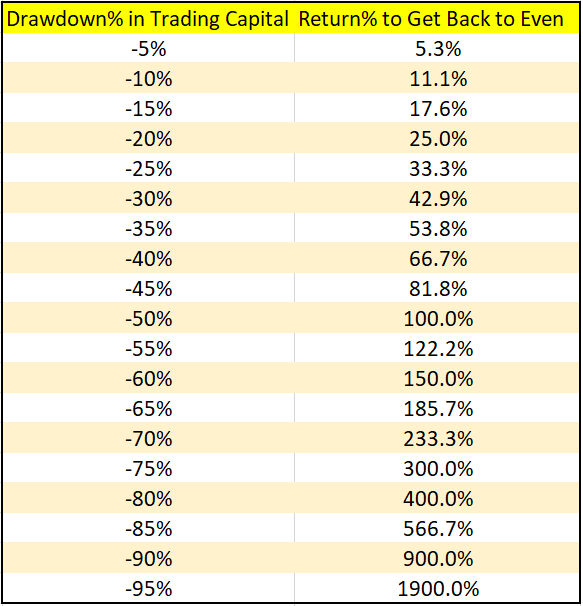
This asymmetric relationship has profound psychological implications for portfolio management. Investors who experience deeper drawdowns face a painful dilemma: they must either accept substantially more risk to pursue the aggressive returns needed for recovery, or endure extended periods underwater waiting for gradual appreciation. Both paths create emotional pressure that often leads to poor decision-making at precisely the wrong time.
By contrast, limiting drawdowns preserves optionality. Portfolios that decline less require more modest returns to reach new highs, allowing managers to maintain disciplined risk postures rather than being forced into aggressive positioning simply to recover lost ground. This is the true value of downside protection, not just smaller losses, but the psychological and strategic freedom that comes from avoiding the recovery trap entirely.
The Professional Standard: Why Risk-Adjusted Returns Matter
The CFA Institute emphasizes that professional investment managers should be evaluated on their ability to deliver returns relative to the risk taken to achieve them. [7] Anyone can generate high returns by taking enormous risks, that's speculation, not portfolio management.
Our 2025 results precisely demonstrate this principle against our benchmark:
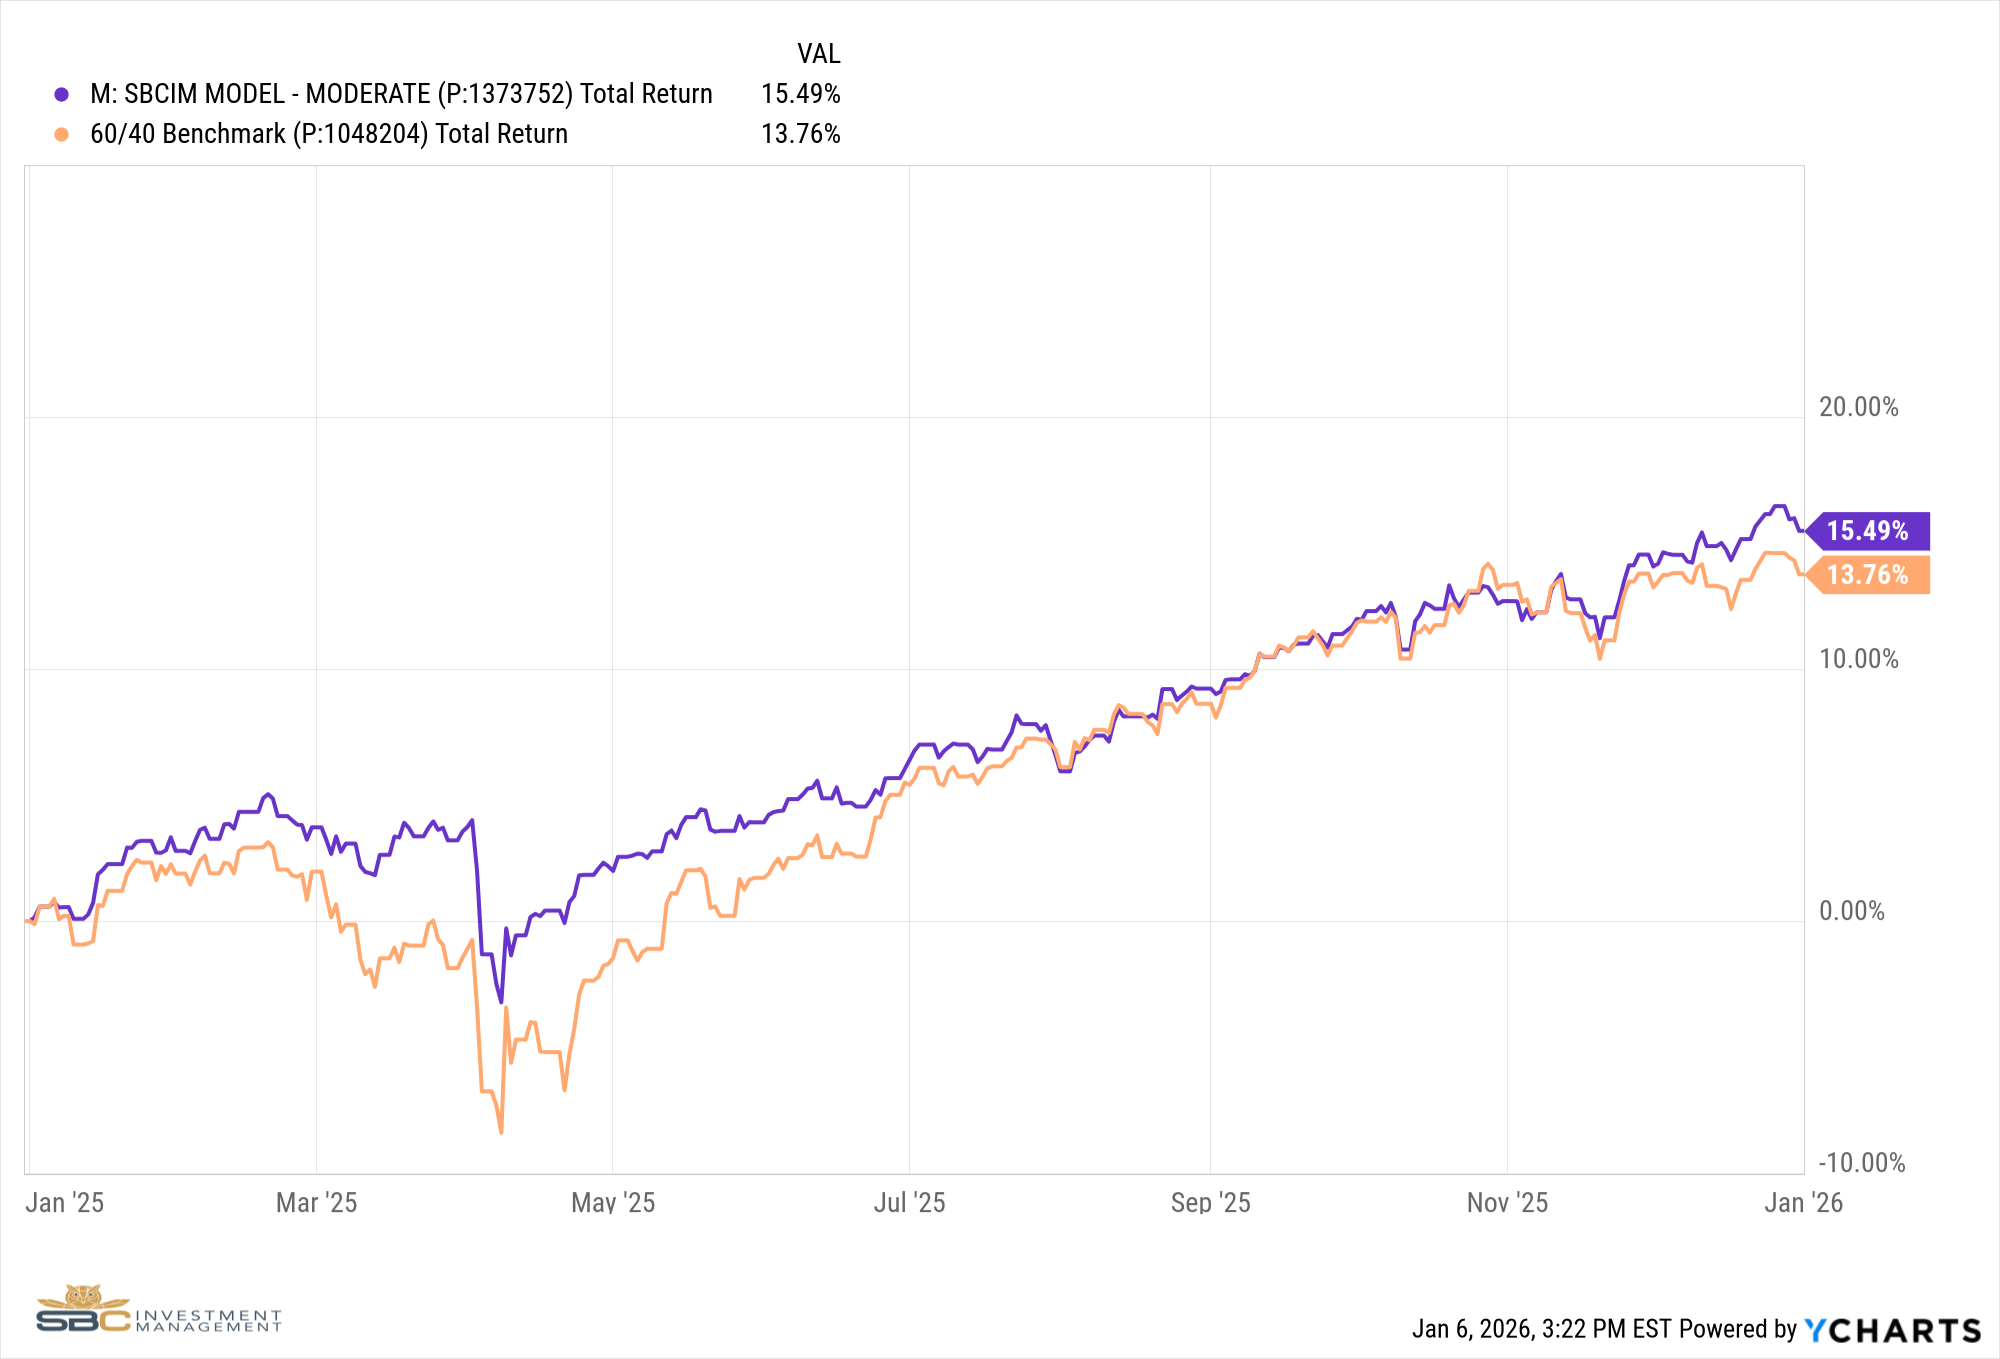
Higher absolute returns: 15.49% vs. 13.76%
Enhanced risk-adjusted returns: Sharpe Ratio of 1.792 vs. 1.020
Significantly smaller drawdowns: 7.8% vs. 11.18%
Over multiple market cycles, the compounding benefits of improved risk-adjusted returns become exponential. A portfolio that consistently avoids severe drawdowns accumulates significantly more wealth over time than one experiencing the full magnitude of market corrections, even if the latter occasionally captures more upside during bull markets.
Looking Forward: Lessons from 2025
The April correction tested strategy, process, and investor psychology. The years’ experience offered several valuable lessons about navigating uncertain markets:
Process Over Predictions: Like most investors, we didn't predict the exact timing or magnitude of April's correction. What helped was maintaining a disciplined process for identifying rising risks and making tactical adjustments, an approach designed to be repeatable across various market scenarios, even when forecasting proves difficult.
The Psychology of Drawdowns: Smaller drawdowns aren't just mathematically advantageous, they're psychologically sustainable. When portfolios decline less, investors find it easier to stay disciplined and invested through recovery periods rather than capitulating at market bottoms, a behavioral advantage that often matters more than the arithmetic itself.
Active Management in Context: Volatile environments with significant dispersion can create opportunities for thoughtful risk management to add value. The 2025 experience reinforced our understanding of when and how tactical positioning may prove beneficial, while also reminding us of its limitations
Capital Preservation Creates Optionality: Limiting drawdowns during April's correction provided strategic flexibility throughout an uncertain year. By avoiding the pressure to pursue aggressive recovery returns, it became possible to maintain more balanced risk management while still participating in the upside, an approach that aims to compound benefits across full market cycles.
Our Commitment
As we enter 2026, our commitment remains unchanged: pursuing greater risk-adjusted returns through disciplined portfolio management. We will continue employing our core-satellite strategy, guided by systematic risk assessment and tactical positioning, as we navigate whatever market environments emerge. Each market cycle provides valuable lessons, and we remain dedicated to continuous refinement of our process, learning from both successes and shortcomings as we work to serve your long-term objectives.
The goal of active management isn't eliminating volatility or predicting the future, it's managing risk thoughtfully, working to preserve capital during stress, and positioning portfolios to participate in recoveries. While 2025 presented encouraging results, we recognize that each year brings unique challenges, and past outcomes don't guarantee future success. We approach 2026 with the same disciplined framework, mindful that markets will test our process in new and unexpected ways.
Thank you for your continued trust in our stewardship of your capital. We welcome your questions about any aspect of this review, our investment approach, or how 2025's experience informs our thinking for the year ahead.
Sources
1. S&P 500 Historical Annual Returns (1927-2025)
2. 5 stock market lessons from 2025 - Travis Kraker | Ameriprise Financial
3. S&P 500 CY 2025 Earnings Preview: Analysts Expect Earnings Growth of 12.1%
4. Calculate the Sharpe Ratio to Gauge Risk | Charles Schwab
5. Risk-Adjusted Return Ratios - Definition, Types
6. Max Drawdown Recovery Rate Cheat Sheet - New Trader U
7. Portfolio Management: An Overview | CFA Institute
Model Performance Update
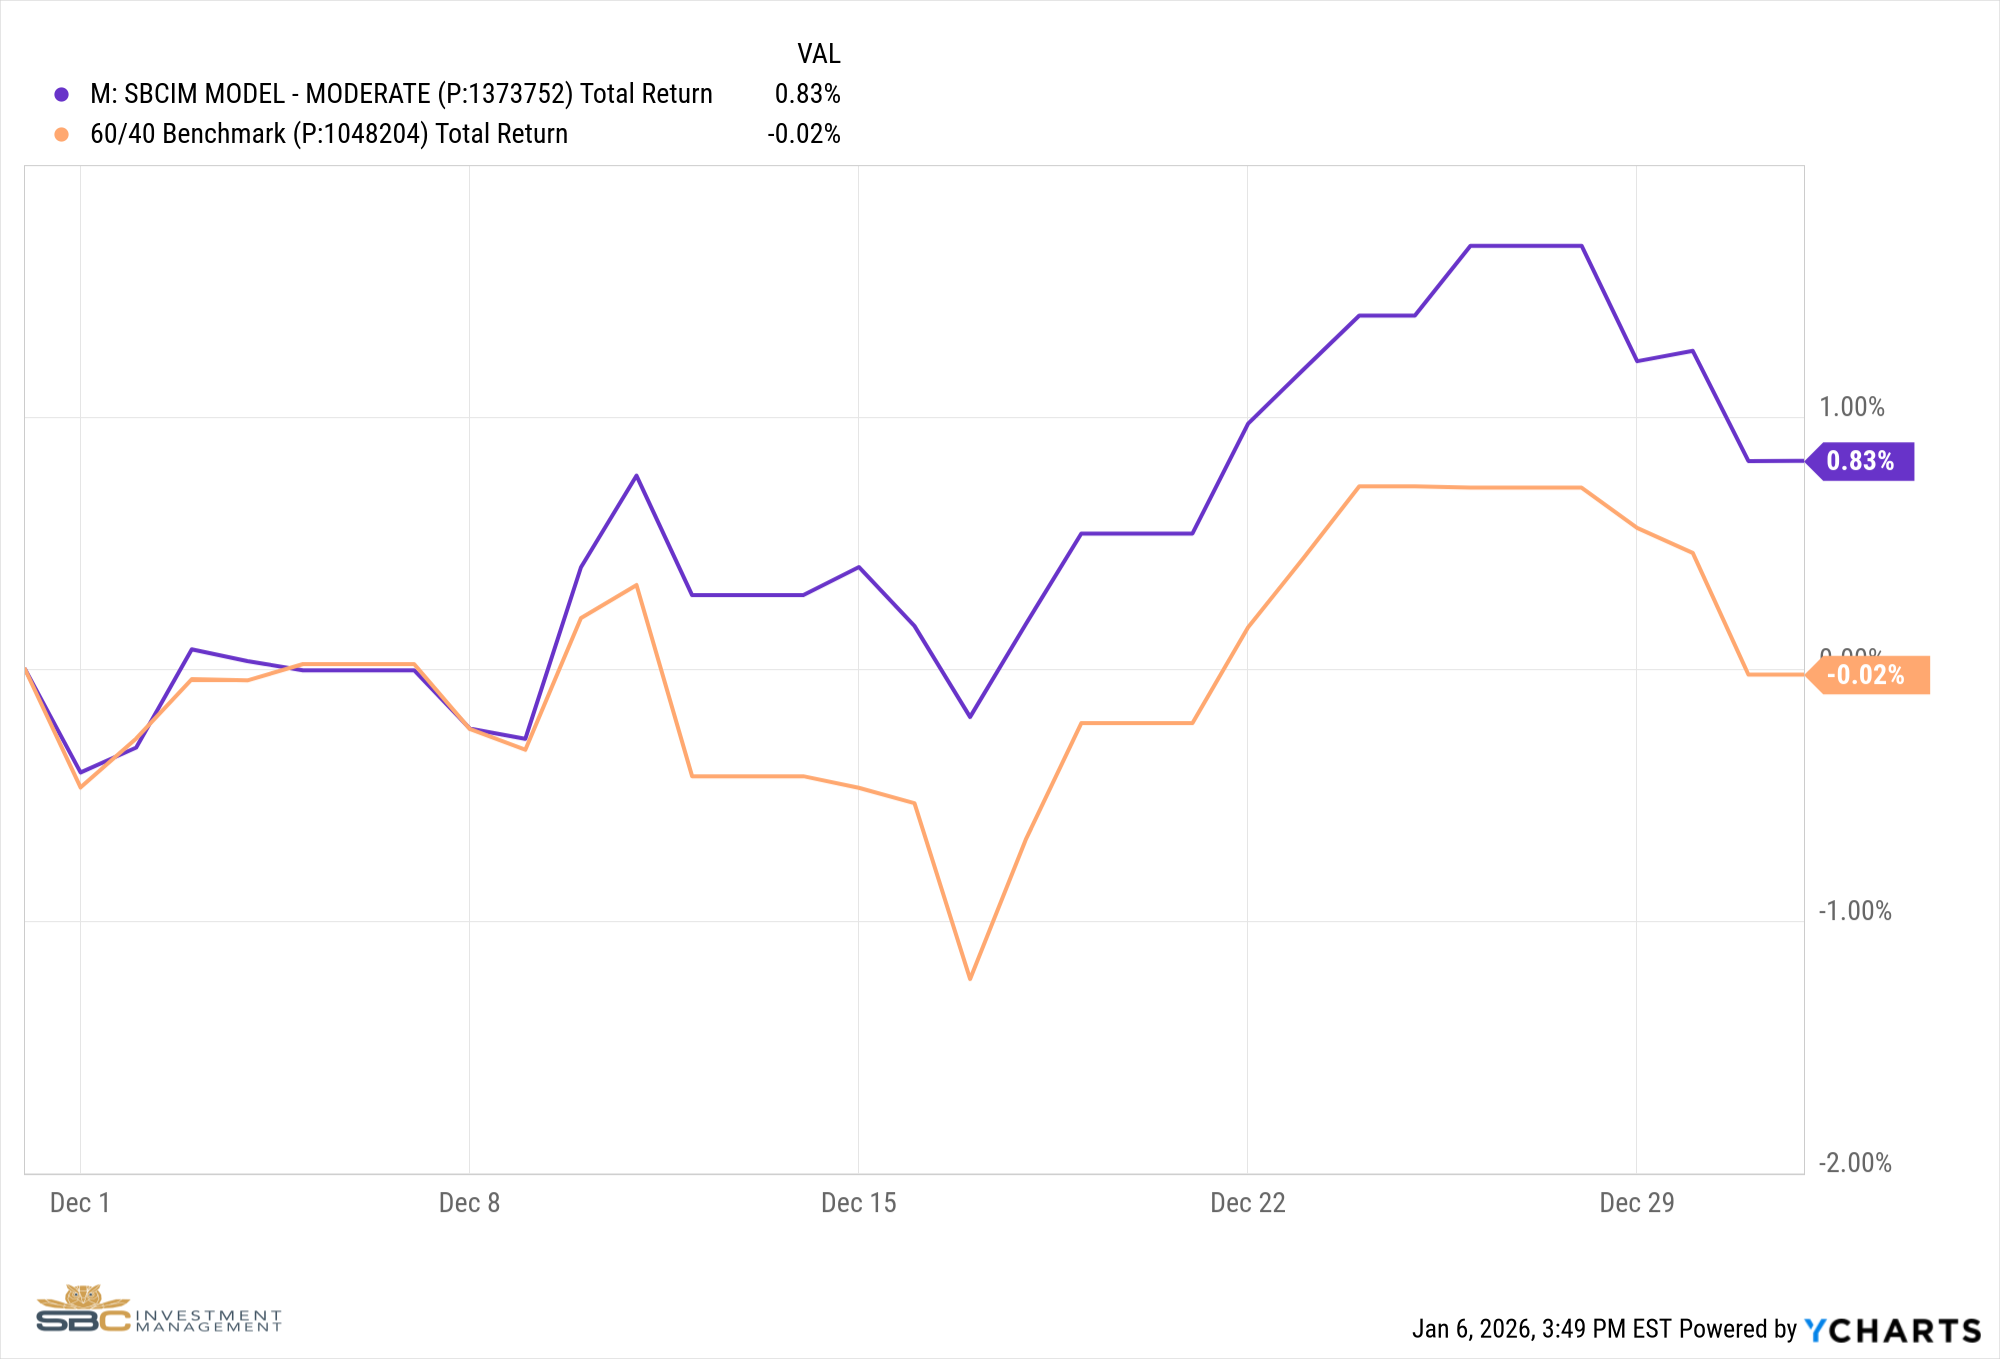
Our Moderate Model Portfolio returned 0.83% in December and returned 15.49% for 2025
Changes to the model portfolio in December
12/8/2025
- Sold UUP (US Dollar) and replaced it with IVOL (Curve Steepener) in Sat3
- Sold TLT (20+ Year Treasuries) and replaced it with LQD (Investment Grade Credit) in Sat2
12/23/2025
- Sold RSP (S&P Equal Weight) in Sat1
- Added EWW (Mexico), EIS (Israel), TUR (Turkey), and XLY (Consumer Discretionary) to Sat1
- Sold IVOL (Curve Steepener) in Sat3
- Transferred 3% cash from Sat3 to Sat2
- Added HYG (High Yield Corp Bonds) to Sat2
December Performance with Benchmark
2025 Performance with Benchmark
If you were to have any questions regarding the above please reach out to us to set up a one to one meeting to review your situation.
Sincerely,
Bryant Andrus, MSF, CFP®
President
SBC Investment Management
P: (602) 641-5996
M: (319) 520-2033
E: bandrus@sbcinvestmentmanagement.com
DISCLAIMERS
SBC Investment Management’s Monthly and Quarterly Market Summary and Outlook is intended to communicate current economic and capital market information along with the informed perspectives of our investment professionals. All expressions of opinion are subject to change. Past performance may not be indicative of future results. There is no assurance that any of the trends discussed will continue, or that any of the forecasts will occur.
You should not construe any information in this publication as investment, financial, or any other professional advice. Nothing contained in this publication constitutes a recommendation, endorsement, or an offer to buy or sell any securities or other financial instruments. You should conduct your own research or speak to your investment advisor before investing.
SBC Investment Management prepares this material as a resource for its clients. This content is for informational purposes only and does not address the circumstances of any particular individual or entity. You may contact us to discuss the content of this publication within the context of your own financial situation.
Past performance may not be indicative of future results. Different types of investments involve varying degrees of risk. There can be no assurance that the future performance of any specific investment, investment strategy (including the investments and/or investment strategies recommended or undertaken by SBC Investment Management, LLC), or any non-investment related content, referred to directly or indirectly in this piece will be profitable, equal any corresponding indicated historical performance level(s), or prove successful. Due to various factors, including changing market conditions and/or applicable laws, the content may no longer be reflective of current opinions or positions. Moreover, you should not assume that any discussion or information contained in this piece serves as the receipt of, or as a substitute for, personalized investment advice from SBC Investment Management, LLC. Investment performance results published herein do not include investment advisory fees paid, or any other related account expenses. Performance results compiled solely by SBC Investment Management, LLC, have not been independently verified, and do not reflect the impact of taxes on non-qualified accounts.
Historical performance results for investment indices (provided for general comparison purposes only), strategies, models and/or indicators generally do not reflect the deduction of an investment management fee, nor the impact of taxes, the incurrence of which would have the effect of decreasing historical performance results. It should not be assumed that your account holdings correspond directly to any comparative indices.
Our past recommendations and model portfolio results are not a guarantee of future results. Using any graph, chart, formula, or other device to assist in deciding which securities to trade or when to trade them presents many difficulties and their effectiveness has significant limitations, including that prior patterns may not repeat themselves continuously or on any particular occasion. In addition, market participants using such devices can impact the market in a way that changes the effectiveness of such device.
Hypothetical performance results shown in this report and on sbcinvestmentmanagement.com are backtested and do not represent the performance of any account managed by SBC Investment Management, LLC. They were achieved by means of the retroactive application of each of the previously referenced models, certain aspects of which may have been designed with the benefit of hindsight.
The hypothetical backtested performance does not represent the results of actual trading using client assets nor decision-making during the period and does not and is not intended to indicate the past performance or future performance of any account or investment strategy managed by SBC Investment Management, LLC. If actual accounts had been managed throughout the period, ongoing research might have resulted in changes to the strategy, which might have altered returns. The performance of any account or investment strategy managed by SBC Investment Management, LLC will differ from the hypothetical backtested performance results for each factor shown herein for a number of reasons, including without limitation the following:
Although SBC Investment Management, LLC may consider from time to time one or more of the factors noted herein in managing any account, it may not consider all or any of such factors. SBC Investment Management, LLC may (and will) from time to time consider factors in addition to those noted herein in managing any account.
SBC Investment Management, LLC may rebalance an account more frequently or less frequently than annually and at times other than presented herein.
The hypothetical backtested performance results for each strategy include estimated values for transaction costs of buying and selling securities, which may not be accurate. Investment management fees, custody and other costs, and taxes – all of which would be incurred by an investor in any account managed by SBC Investment Management, LLC are not included in performance results. If such costs and fees were reflected, the hypothetical backtested performance results would be lower.
The hypothetical performance does not reflect the reinvestment of dividends and distributions therefrom, interest, capital gains and withholding taxes.
Accounts managed by SBC Investment Management, LLC are subject to additions and redemptions of assets under management, which may positively or negatively affect performance depending generally upon the timing of such events in relation to the market’s direction.
Simulated returns may be dependent on the market and economic conditions that existed during the period. Future market or economic conditions can adversely affect the returns.
SBC Investment Management, LLC is neither a law firm nor a certified public accounting firm. No portion of our website, our newsletter content, or any other correspondence from us should be construed as legal or accounting advice.