
Staying Steady Through the Storm
Commentary:
In last month’s newsletter “Earnings Shine as Government Shutdown Clouds the Dashboard” we discussed the possibility of increased volatility on the horizon. The record-long government shutdown had created uncertainty in the market, making it difficult to get a clear read on economic data. While our view was to remain positive about the longer-term outlook of the markets, we decided to take some risk off the table. We had shifted 2% of our stock exposure and used some excess cash to initiate a 3% position in the US Dollar, an investment that typically holds up when markets get choppy.
As it turned out, November delivered the volatility we were anticipating. After the government reopened, markets experienced a notable pullback. The S&P 500 fell 5.11% from its peak, while the Nasdaq dropped 7.34%. [2] Then came Thanksgiving week, on low trading volume, markets made a sharp turnaround with the S&P 500 and Nasdaq jumping 3.46% and 4.71%, respectively, erasing most of the month’s losses.
By the end of November, the damage was minimal, but the ride was bumpy. This is exactly the kind of environment where being positioned defensively pays off. The recovery was impressive, but came on light trading volume, a reminder that holiday-week rallies can sometimes be less reliable than moves that happen when all investors are actively participating.
The economic picture remains mixed but generally constructive. Corporate earnings for Q3 came in strong, with most S&P 500 companies beating expectations. Further tax cuts and government spending can provide a tailwind for the markets ahead. For now, the Federal Reserve remains the biggest question mark. After cutting rates twice earlier in the fall, Fed officials are now divided about what to do next. According to PolyMarket, the odds of a December rate cut began the month at 67%, fell to 22% mid-month, and finished the month at an 89% probability. [1] While rate cuts tend to support stock valuations, the fed continues to walk on a tight rope. Cut too much, and inflation could heat back up. Cut too little, and the economy could slow down more than necessary. This makes the December decision particularly interesting.
Conclusion:
Despite the recovery in the late month, our near-term view remains cautiously bullish. In plain English, we believe there are enough monetary and fiscal tailwinds to push equities higher over the next 6-12 months, particularly heading into 2026. However, in the near-term we are being selective and defensive. To put November's move in perspective, the S&P 500 remains up ~37% from its April lows, an incredible run. Our tactical shift away from stocks and into the dollar was relatively small (just 2%) and served a specific purpose: locking in some profits after our aggressive move to overweight equities in late July. We are not trying to perfectly time the market; rather, we are simply trying to manage risk intelligently.
That said, we continue to favor technology and small caps as we look ahead to 2026. These sectors offer the most compelling risk-reward in our view, which is why we marginally added to our QQQ (Tech) and IWM (Small Caps) positions earlier in the month. We see these areas as best positioned to benefit from the Fed's eventual policy pivot and potential fiscal stimulus, while also offering the innovation and growth characteristics we want to capture in a recovering economic environment.
While the long-term outlook remains positive, we're maintaining our slightly more defensive posture for now. The current economic environment provides opportunities to generate positive returns while keeping overall volatility low during this "foggy time" as the Fed figures out its next moves. Our approach is deliberate: reduce excess risk where appropriate but stay positioned in the sectors we believe will lead the market higher.
Sources
1. Fed decision in December? Odds & Predictions (2025) | Polymarket
Model Performance Update
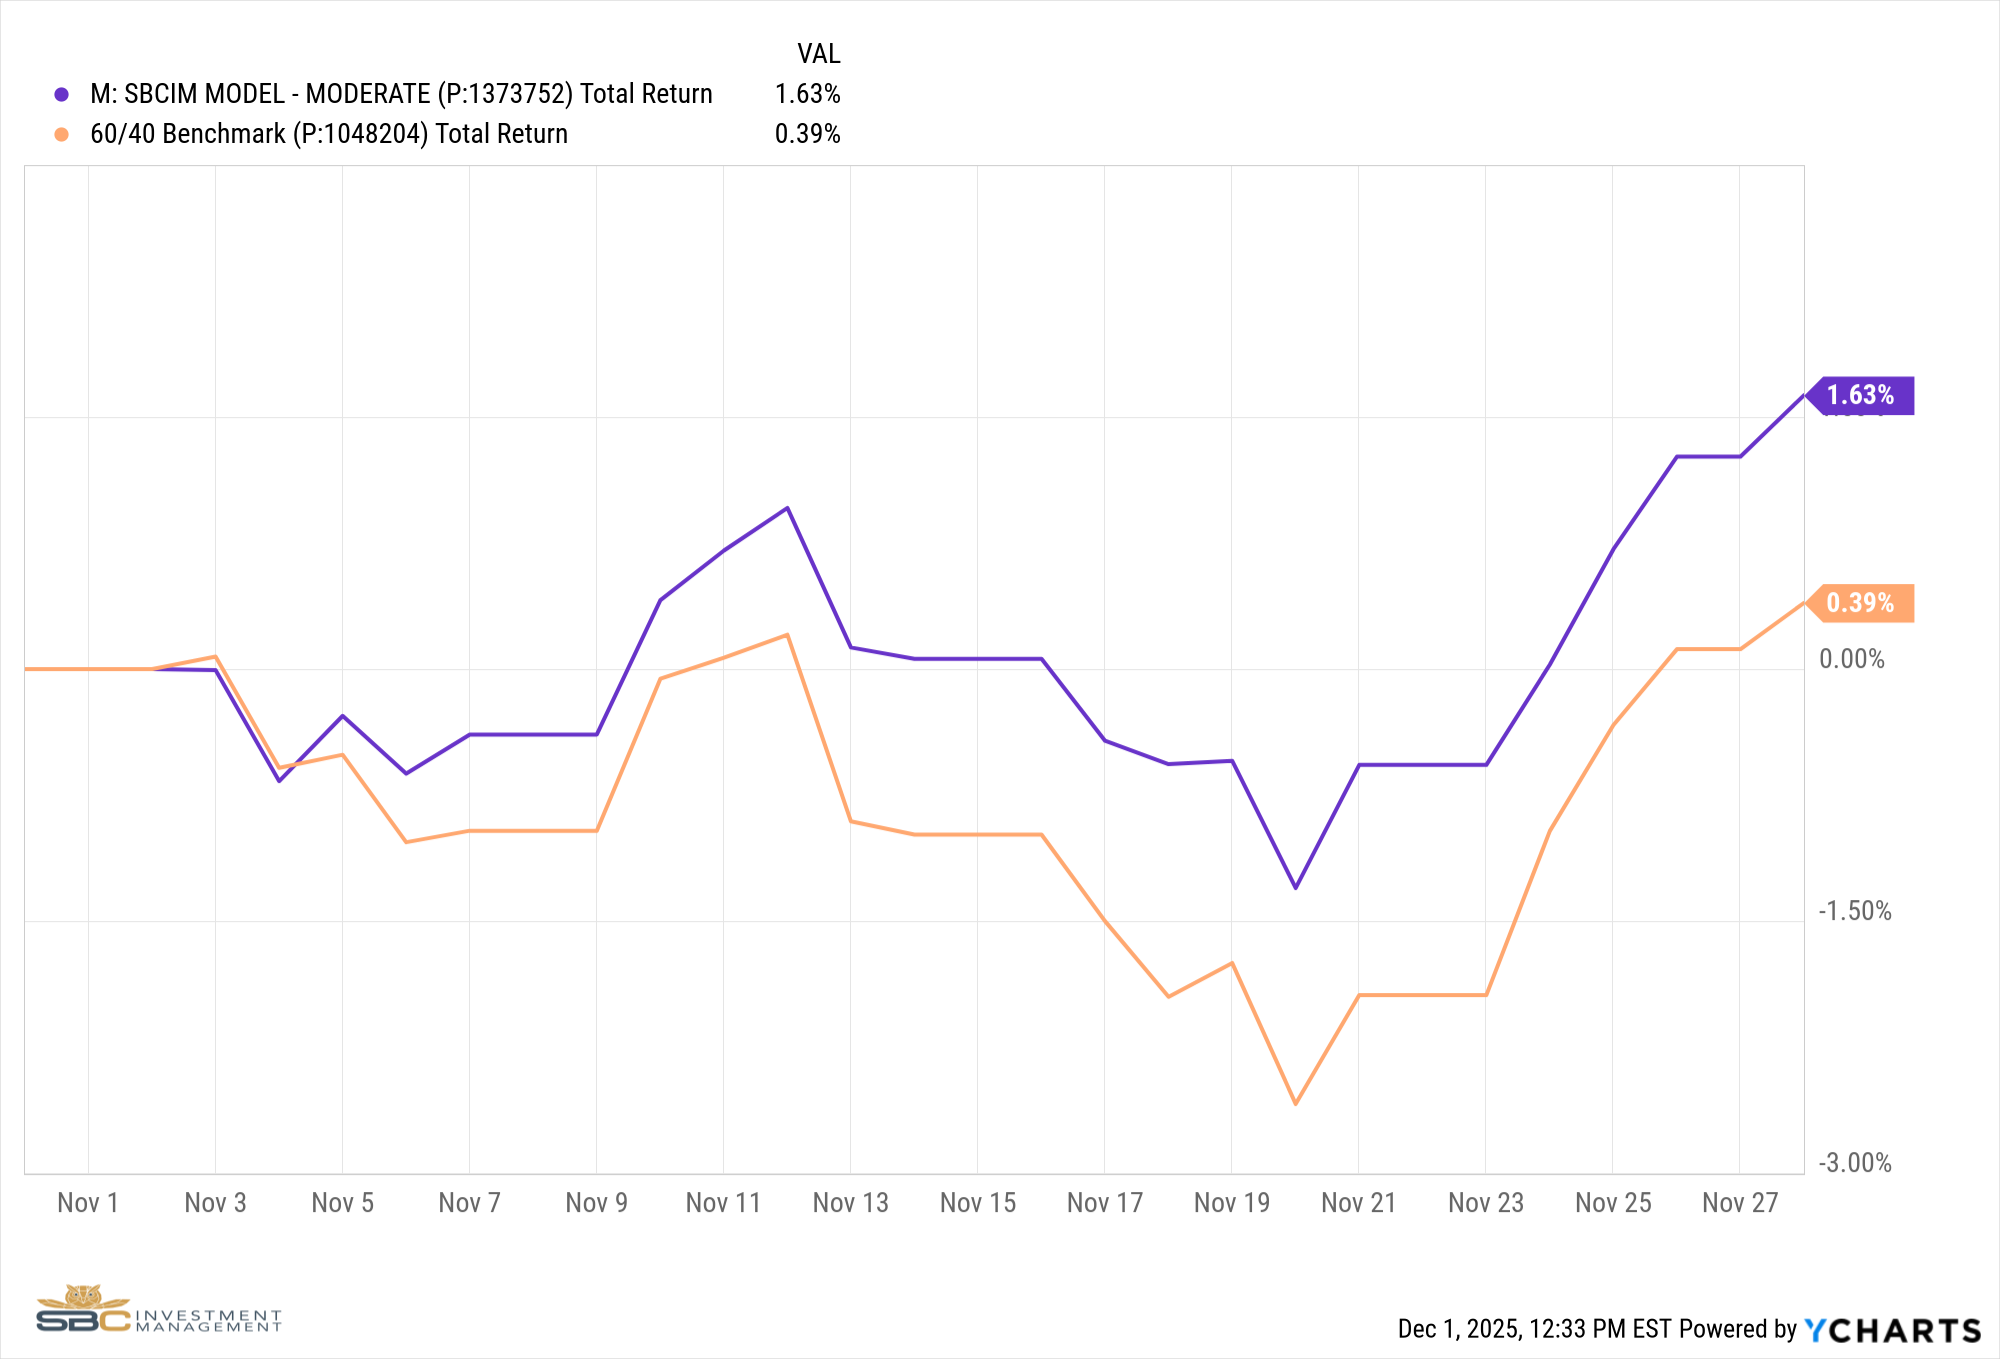
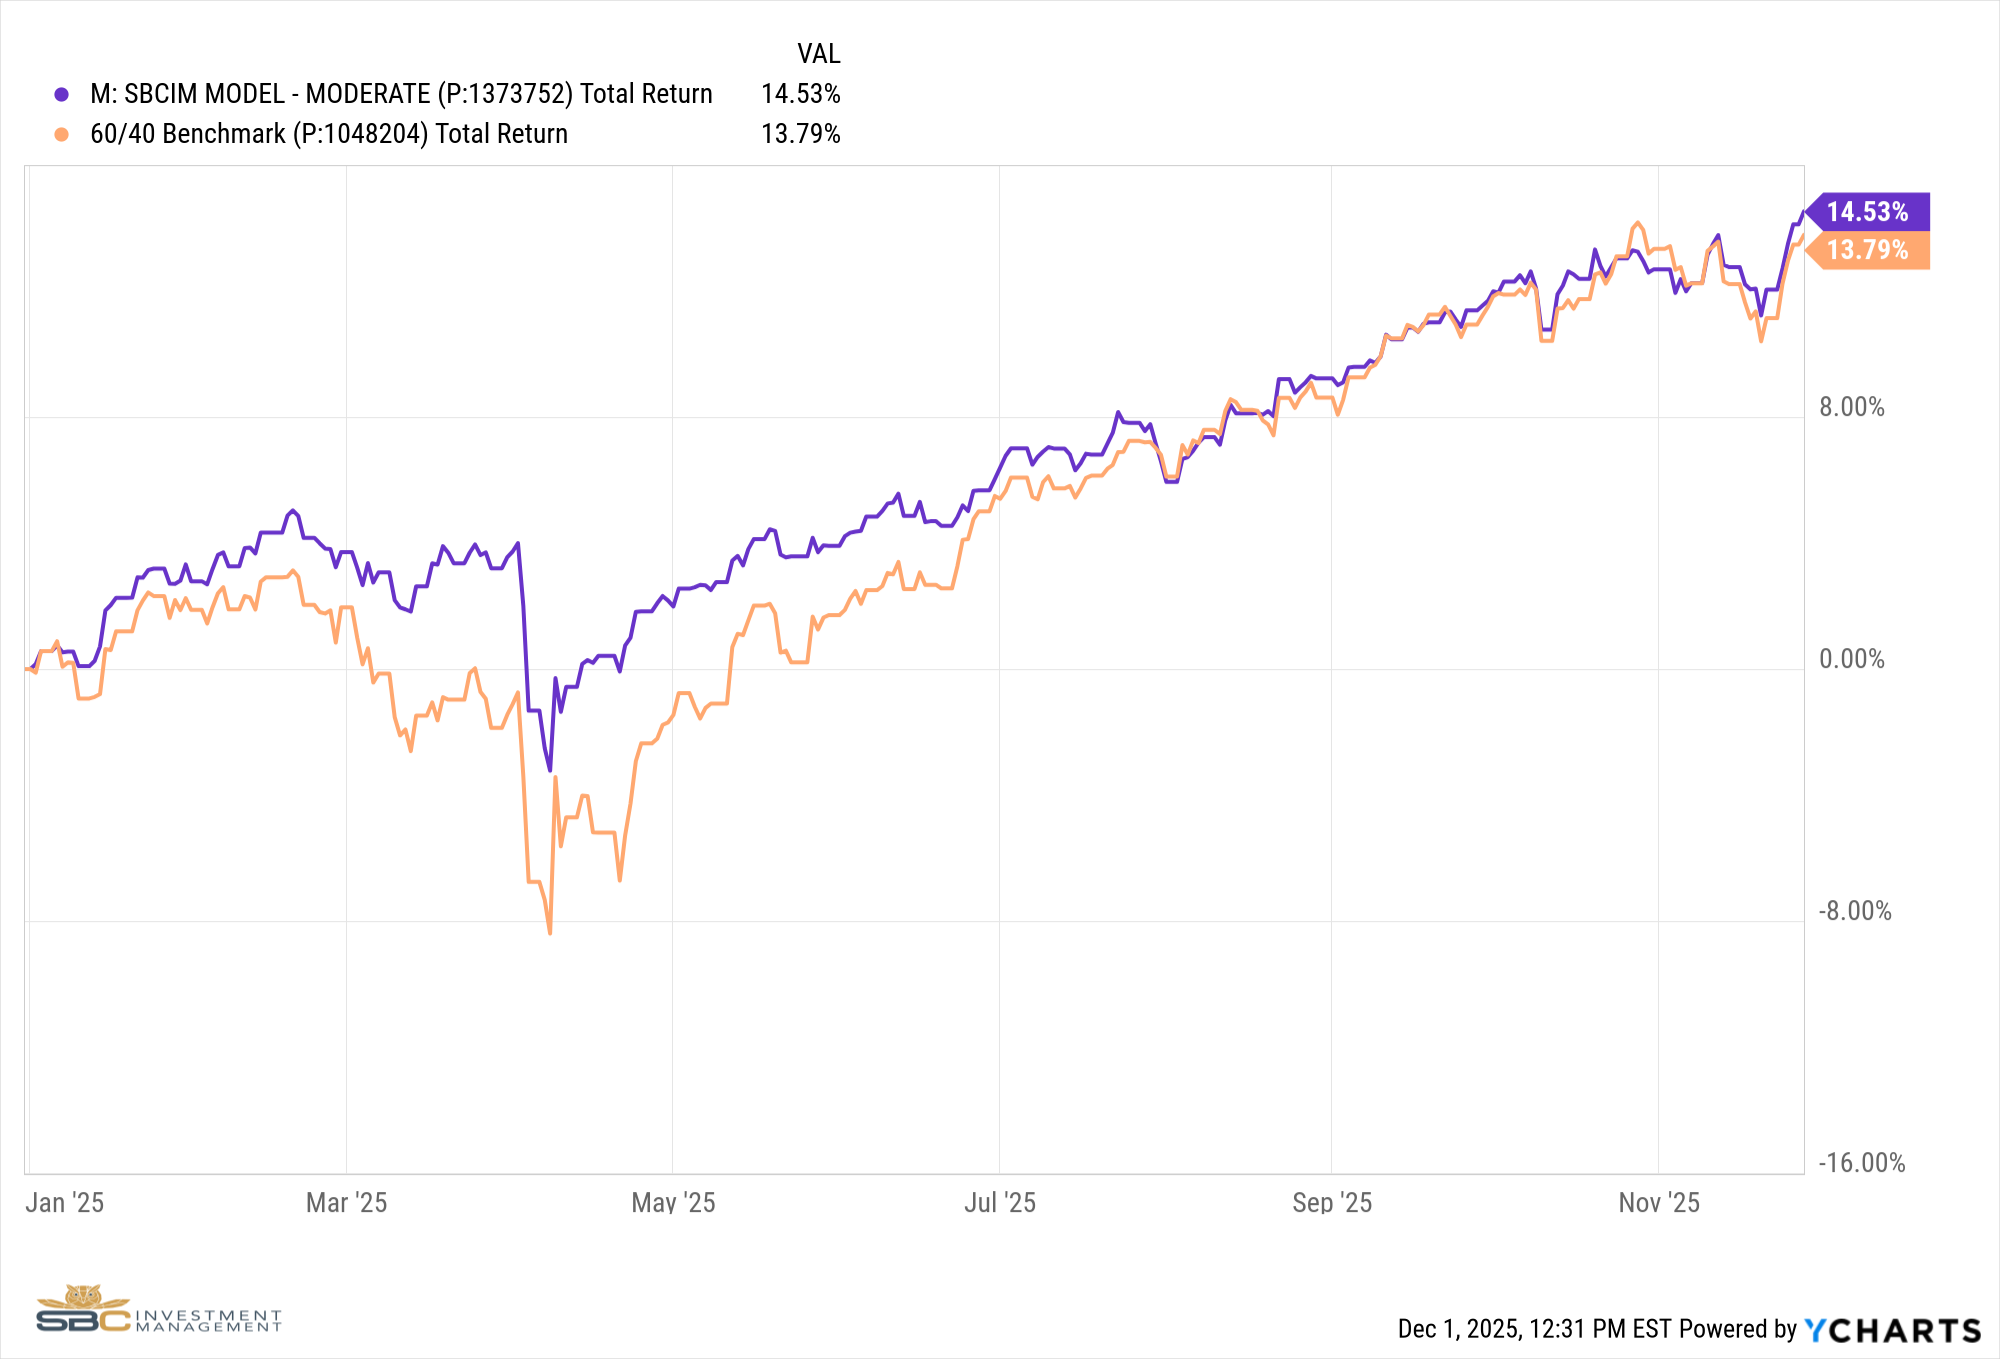
Our Moderate Model Portfolio returned 1.63% in November and has returned 14.53% YTD
Changes to the model portfolio in November
11/7/2025
- Removed EWA (Australia) from Satellite 1
- Added to QQQ (Tech) and IWM (Small Caps) in Satellite 1
November Performance with Benchmark
YTD Performance with Benchmark
If you were to have any questions regarding the above please reach out to us to set up a one to one meeting to review your situation.
Sincerely,
Bryant Andrus, MSF, CFP®
President
SBC Investment Management
P: (602) 641-5996
M: (319) 520-2033
E: bandrus@sbcinvestmentmanagement.com
DISCLAIMERS
SBC Investment Management’s Monthly and Quarterly Market Summary and Outlook is intended to communicate current economic and capital market information along with the informed perspectives of our investment professionals. All expressions of opinion are subject to change. Past performance may not be indicative of future results. There is no assurance that any of the trends discussed will continue, or that any of the forecasts will occur.
You should not construe any information in this publication as investment, financial, or any other professional advice. Nothing contained in this publication constitutes a recommendation, endorsement, or an offer to buy or sell any securities or other financial instruments. You should conduct your own research or speak to your investment advisor before investing.
SBC Investment Management prepares this material as a resource for its clients. This content is for informational purposes only and does not address the circumstances of any particular individual or entity. You may contact us to discuss the content of this publication within the context of your own financial situation.
Past performance may not be indicative of future results. Different types of investments involve varying degrees of risk. There can be no assurance that the future performance of any specific investment, investment strategy (including the investments and/or investment strategies recommended or undertaken by SBC Investment Management, LLC), or any non-investment related content, referred to directly or indirectly in this piece will be profitable, equal any corresponding indicated historical performance level(s), or prove successful. Due to various factors, including changing market conditions and/or applicable laws, the content may no longer be reflective of current opinions or positions. Moreover, you should not assume that any discussion or information contained in this piece serves as the receipt of, or as a substitute for, personalized investment advice from SBC Investment Management, LLC. Investment performance results published herein do not include investment advisory fees paid, or any other related account expenses. Performance results compiled solely by SBC Investment Management, LLC, have not been independently verified, and do not reflect the impact of taxes on non-qualified accounts.
Historical performance results for investment indices (provided for general comparison purposes only), strategies, models and/or indicators generally do not reflect the deduction of an investment management fee, nor the impact of taxes, the incurrence of which would have the effect of decreasing historical performance results. It should not be assumed that your account holdings correspond directly to any comparative indices.
Our past recommendations and model portfolio results are not a guarantee of future results. Using any graph, chart, formula, or other device to assist in deciding which securities to trade or when to trade them presents many difficulties and their effectiveness has significant limitations, including that prior patterns may not repeat themselves continuously or on any particular occasion. In addition, market participants using such devices can impact the market in a way that changes the effectiveness of such device.
Hypothetical performance results shown in this report and on sbcinvestmentmanagement.com are backtested and do not represent the performance of any account managed by SBC Investment Management, LLC. They were achieved by means of the retroactive application of each of the previously referenced models, certain aspects of which may have been designed with the benefit of hindsight.
The hypothetical backtested performance does not represent the results of actual trading using client assets nor decision-making during the period and does not and is not intended to indicate the past performance or future performance of any account or investment strategy managed by SBC Investment Management, LLC. If actual accounts had been managed throughout the period, ongoing research might have resulted in changes to the strategy, which might have altered returns. The performance of any account or investment strategy managed by SBC Investment Management, LLC will differ from the hypothetical backtested performance results for each factor shown herein for a number of reasons, including without limitation the following:
Although SBC Investment Management, LLC may consider from time to time one or more of the factors noted herein in managing any account, it may not consider all or any of such factors. SBC Investment Management, LLC may (and will) from time to time consider factors in addition to those noted herein in managing any account.
SBC Investment Management, LLC may rebalance an account more frequently or less frequently than annually and at times other than presented herein.
The hypothetical backtested performance results for each strategy include estimated values for transaction costs of buying and selling securities, which may not be accurate. Investment management fees, custody and other costs, and taxes – all of which would be incurred by an investor in any account managed by SBC Investment Management, LLC are not included in performance results. If such costs and fees were reflected, the hypothetical backtested performance results would be lower.
The hypothetical performance does not reflect the reinvestment of dividends and distributions therefrom, interest, capital gains and withholding taxes.
Accounts managed by SBC Investment Management, LLC are subject to additions and redemptions of assets under management, which may positively or negatively affect performance depending generally upon the timing of such events in relation to the market’s direction.
Simulated returns may be dependent on the market and economic conditions that existed during the period. Future market or economic conditions can adversely affect the returns.
SBC Investment Management, LLC is neither a law firm nor a certified public accounting firm. No portion of our website, our newsletter content, or any other correspondence from us should be construed as legal or accounting advice.