
Broadening the Rotation
A Bull Market Entering Its Fourth Year
The current bull market, which began on October 12, 2022, recently celebrated its third anniversary and has now entered its 4th year. During this time, the S&P 500 has seen a 103% surge from its bear market low. For the past three years, this rally has been powered predominantly by a narrow group of technological stocks, commonly known as the Magnificent 7. Collectively, the Magnificent Seven climbed 76% in 2023, 48% in 2024, and 23% in 2025, outperforming the S&P 500’s returns of 24%, 25%, and 16% in those respective years. [1]
This concentration has created a historic market structure with the Magnificent Seven now representing approximately 35% of the entire S&P 500’s market cap, up dramatically from roughly 20% at the October 2022 bear market low. [2] Put differently, just seven companies out of 500 now account for more than one-third of the index value.
Entering year four of this bull market the fundamental backdrop looks strong: economic growth is accelerating, headline inflation is decelerating toward 2%, and the Fed is cutting rates. But there's a concentration problem we can't ignore. The Magnificent Seven now represents 35% of the S&P 500, meaning a traditional index investor is betting more than a third of their portfolio on just seven companies. The challenge ahead isn't about abandoning equities; it's about finding smarter, more diversified ways to participate in the continued bull market without excessive concentration risk.
Before we explore those strategies, it’s worth understanding just how much runway this bull market may still have.
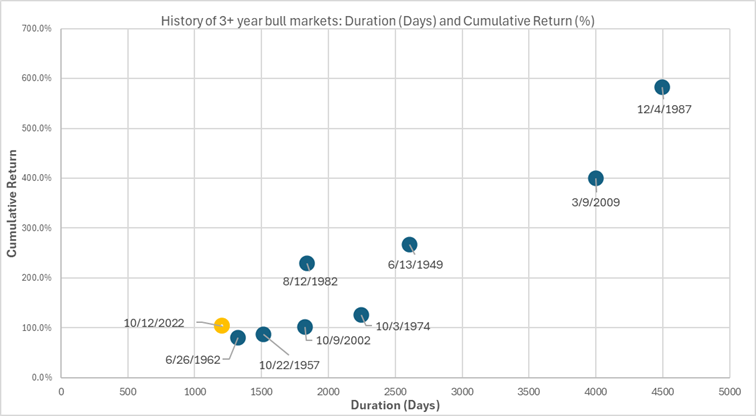
Figure 1: History of 3+ Year Bull Markets [3]
The chart above tells a compelling story. Among all bull markets that have lasted at least three years, the current cycle (highlighted in orange) stands out, not only for its age, but also for how much room it may still have to run. At just over 1,200 days and a 103% cumulative gain, today’s bull market sits in the lower left quadrant of the chart, well below the performance trajectory of its most successful predecessors.
History suggests this bull market isn’t old; its barely middle aged. Bulls don’t die of old age, they typically end when the economy tips into a recession, the feds overtighten, or valuations become unsustainably stretched. None of those conditions appear imminent currently. With GDP growth accelerating, inflation cooling, and a stimulative monetary and fiscal policy, the macro environment remains supportive of equities.
It’s not a question as to whether to stay invested, but how to stay invested prudently as leadership broadens beyond the Magnificent Seven.
If You're Feeling Left Behind Letely, You're Not Alone
If you've checked your portfolio lately and felt underwhelmed, you are not alone. Many investors hold passive index funds, and those funds primarily track the market cap weighted S&P 500. Since November 1st, 2025, the S&P 500 has gained just 0.89% (as of 2/3/2026), a far cry from the double-digit returns investors have grown accustomed to over the past three years. Understandably this is a relatively short time frame, but for those holding a traditional cap-weighted index fund, it may feel like the market has stalled these last 3 months. But here's what the headline numbers aren't telling you: the market hasn't stalled, it's just left the S&P 500 behind.
Beneath the surface, a powerful rotation is underway. Small-caps, mid-caps, equal-weight strategies, and the broader universe of stocks outside the Magnificent Seven have been delivering strong returns. The problem isn't the market, it's that the S&P 500's ~35% concentration in just seven mega-cap stocks is acting as an anchor on performance. When those seven companies stumble, the index barely moves, even as hundreds of other stocks rally. This is precisely why concentration risk matters, and why now more than ever, diversification isn't just prudent risk management; it's essential for capturing the returns that are still being generated across the broader market.
Have We Already Started to See the Underlying Shift?
For the past three years, the Magnificent Seven's dominance was justified by a substantial earnings growth advantage. But that gap is closing rapidly, and the rotation we're witnessing isn't speculation, it's a market responding to an earnings convergence that's already underway.
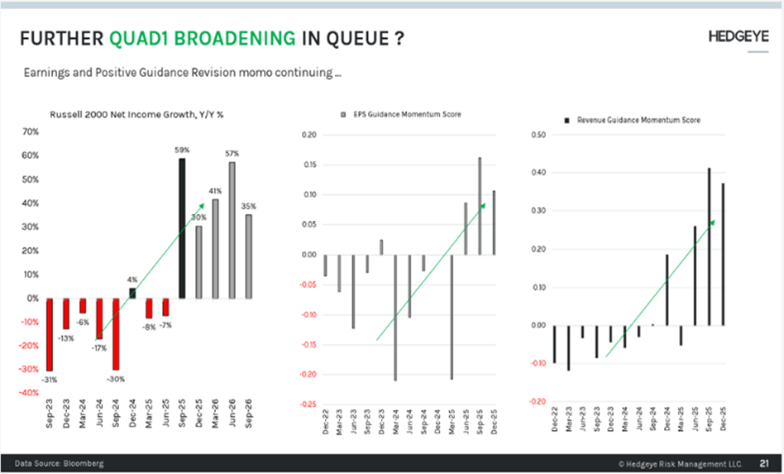
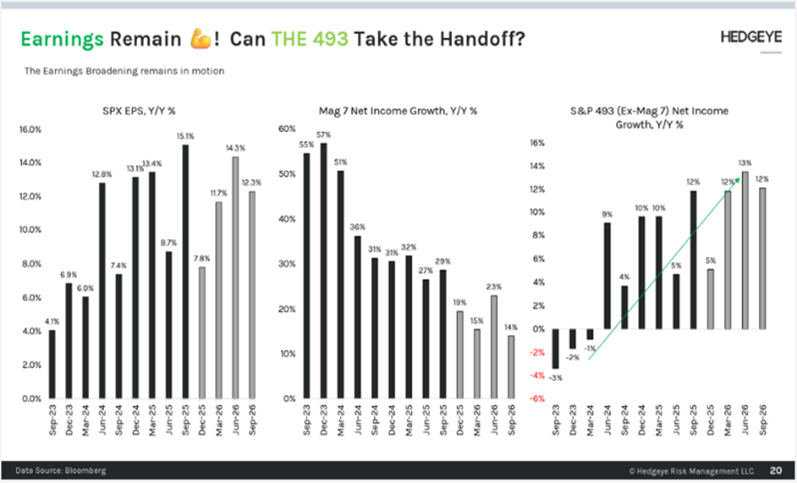
Figure 2 & 3: Sequential Earnings Growth Trends
Source: Hedgeye Risk Management, Q1 2026 Themes Presentation, January 2026. Charts illustrate Russell 2000 and S&P 493 (ex-Magnificent Seven) sequential earnings growth trends and guidance momentum scores
As you can see from the images above, just two years ago, the Magnificent Seven were delivering explosive year over year earnings growth, peaking near 57% in late 2023, while the S&P 493 and the broader market struggled with negative to low single digit growth. That disparity justified the Mag 7's outperformance. But look at the trend lines today: the Magnificent Seven's earnings growth has decelerated steadily, dropping from the high 50s to an estimated mid 20s range, while the S&P 493 have emerged from negative territory and are now accelerating, with year over year earnings growth climbing toward the low to mid-teens.
This convergence, where the "other 493" are gaining momentum while the Mag 7 cool off, is the fundamental catalyst driving the rotation we're witnessing in the market.
Key Earnings Growth Projections for 2026:
Magnificent Seven: Expected to grow earnings approximately 18% in 2026, the slowest pace since 2022 [4]
The S&P 493 (ex-Mag 7): Projected earnings growth of roughly 13% in 2026, narrowing what was historically a massive gap [4]
Russell 2000 Small-Caps: Forecasted to deliver 19% year-over-year earnings growth in 2026, and analysts project the Russell 2000 will grow earnings at approximately 35% annually over the next two years—more than double the S&P 500's projected 14% rate [5] [6]
This convergence is critical. Markets eventually follow earnings. When the Magnificent Seven were growing earnings at 2-3x the rate of the broader market, their outperformance made sense. But as that advantage narrows, and in the case of small-caps, reverses, we should expect market leadership to broaden accordingly.
According to Goldman Sachs, the earnings gap between the Magnificent Seven and the other 493 companies is projected to shrink to just 4 percentage points in 2026, down from double-digit differentials in prior years [7]. Bloomberg Intelligence data shows a similar trend, with profit growth for the Mag 7 slowing while growth for the other 493 companies accelerates at a similar 13% rate [4].
Performance Confirms the Rotation
Theory is one thing; market action is another. When growth in earnings broadens, performance typically follows, and that's precisely what we've witnessed since November 2025. The chart below compares the S&P 500 to the Russell 2000 (small cap), S&P 400 (mid cap), and the S&P 500 Equal Weight Index, which have all significantly outperformed the market-cap-weighted S&P 500 in recent months.
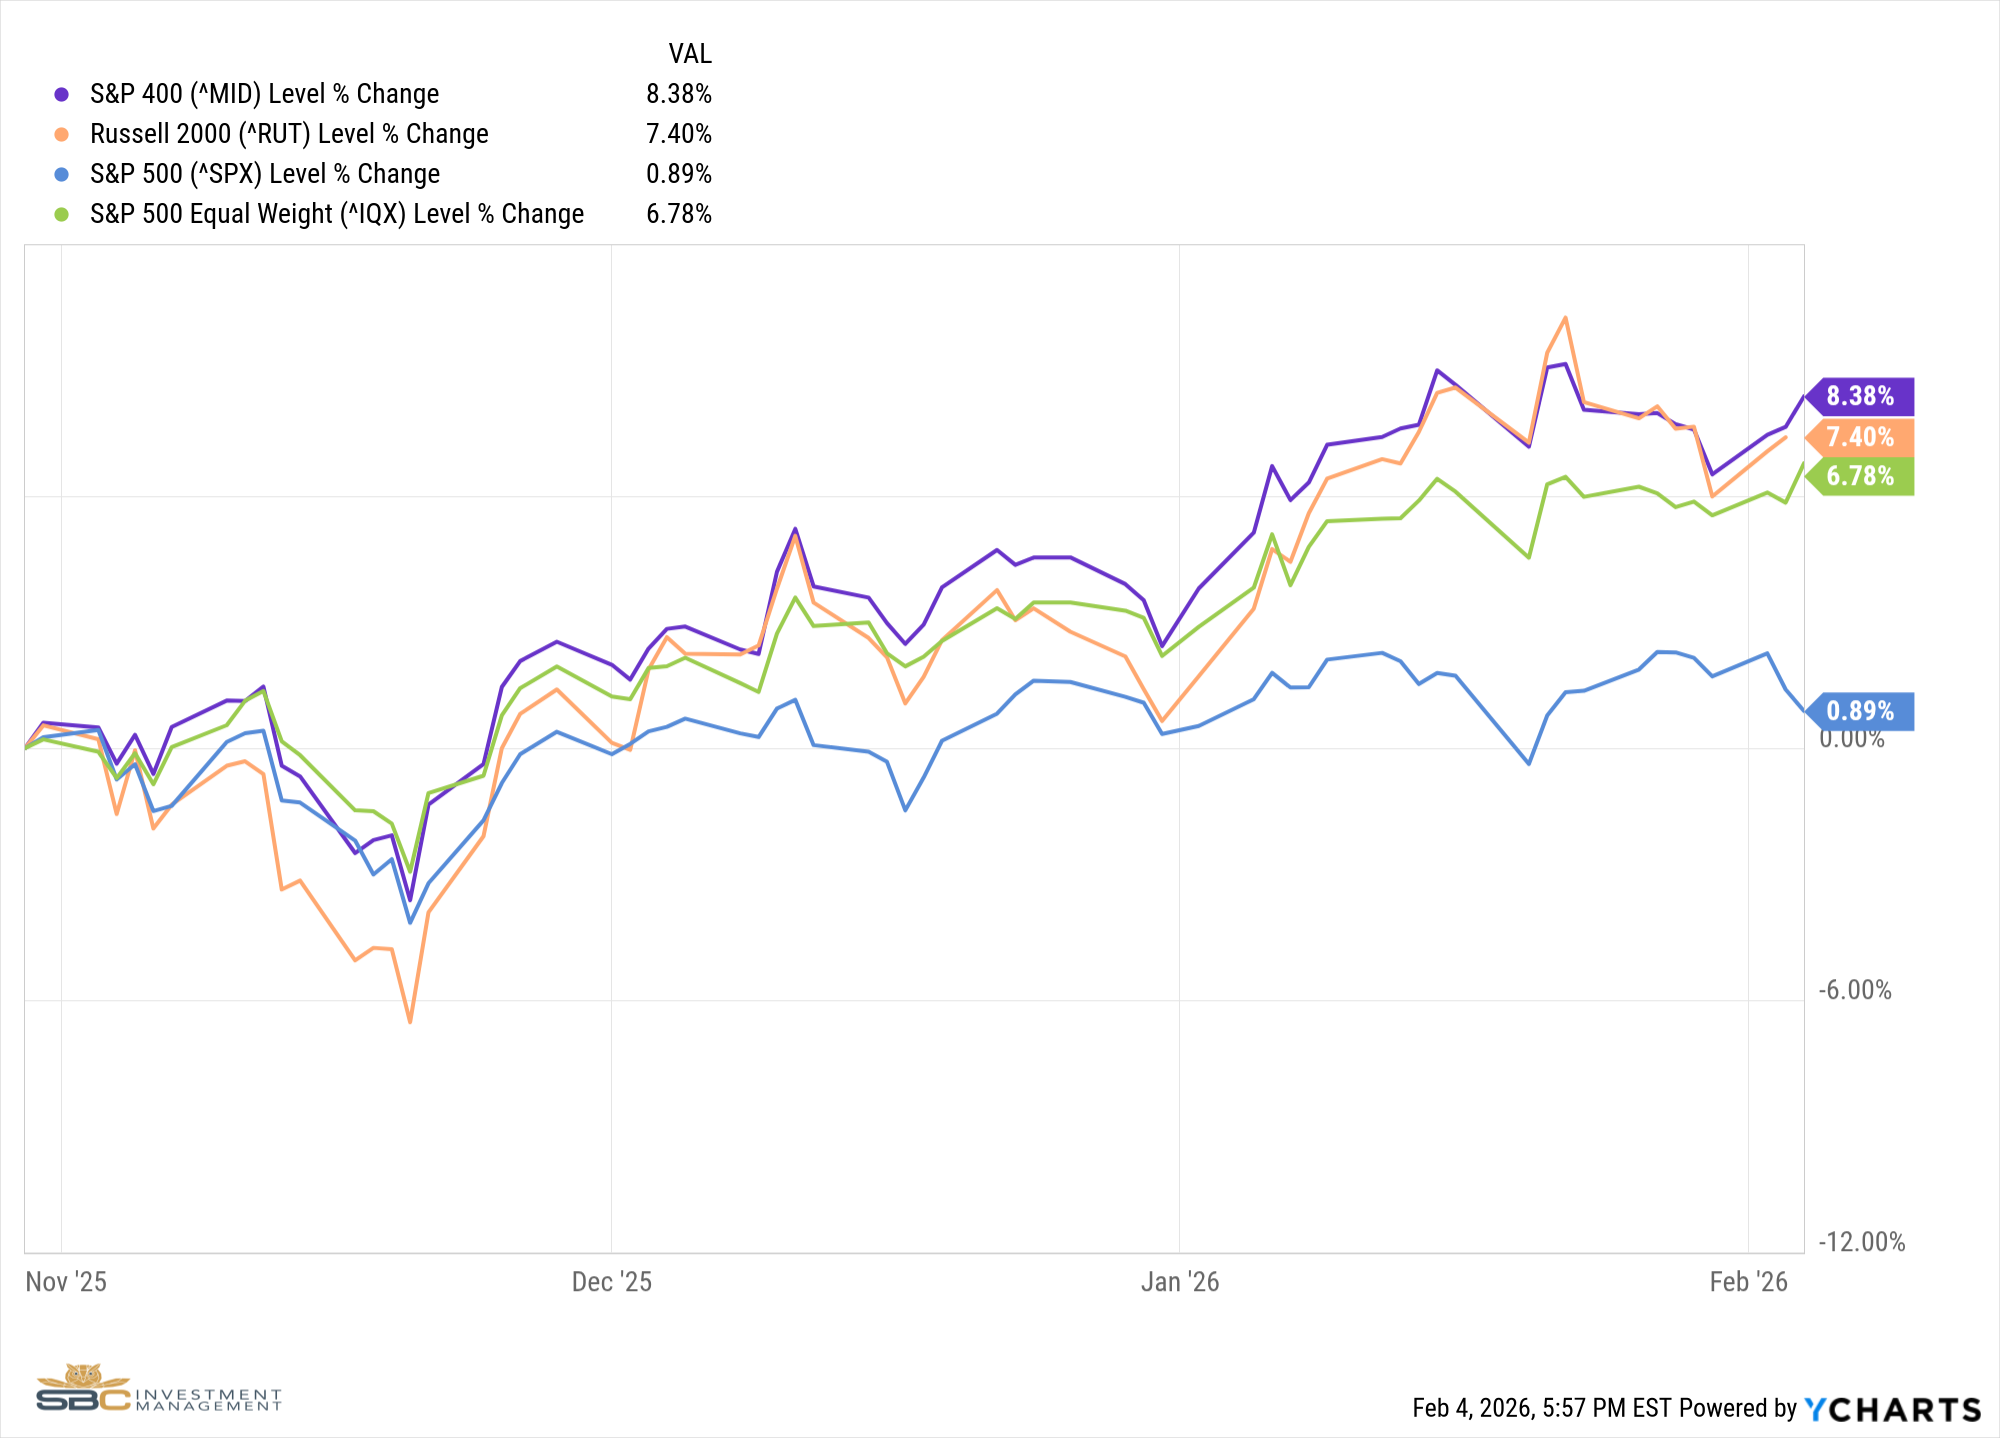
What can you take from this? The returns are there, they're just not where they used to be. Investors concentrated solely in cap-weighted S&P 500 index funds are missing the rally happening across the rest of the market.
Positioning for the Next Chapter
With leadership beginning to broaden beyond the Magnificent Seven, we see an opportunity to stay fully invested while improving diversification and reducing concentration risk.
• Use a more diversified core equity approach (e.g., equal-weight or multi-factor) to reduce single-stock concentration.
• Add targeted small- and mid-cap exposure to participate in areas where earnings momentum is improving.
• Balance growth exposure with value and cyclical tilts where valuations are more forgiving and economic resilience can be rewarded.
• Consider selective international exposure to diversify beyond U.S. mega-cap leadership.
This isn’t about abandoning yesterday’s winners, it’s about positioning for broader participation in the market’s next phase.
Ultimately, the most important takeaway is that markets can evolve even when the headline index appears stuck. Beneath the surface, leadership has begun to broaden, and that typically creates a wider opportunity set while reducing reliance on a handful of mega-cap names. Our focus remains on staying invested, managing concentration risk thoughtfully, and keeping portfolios positioned to participate if the next phase of this cycle is driven by a broader group of companies.
Sources
1. What could go right (and wrong) in 2026 | Weekly Market Update - IPS
2. Investors all-in on Mag 7 stocks face weighty market decision in 2026
4. The Great Convergence: A Structural Shift in Market Leadership and Portfolio Construction
5. US small caps: A tale of two halves | Aberdeen
6. Why Small-Cap Stocks Could Finally Beat the S&P 500 - Barron's
7. FinancialContent - The Great Convergence: S&P 493 Surges as the 'Magnificent Seven' Grip Loosens
Model Performance Update
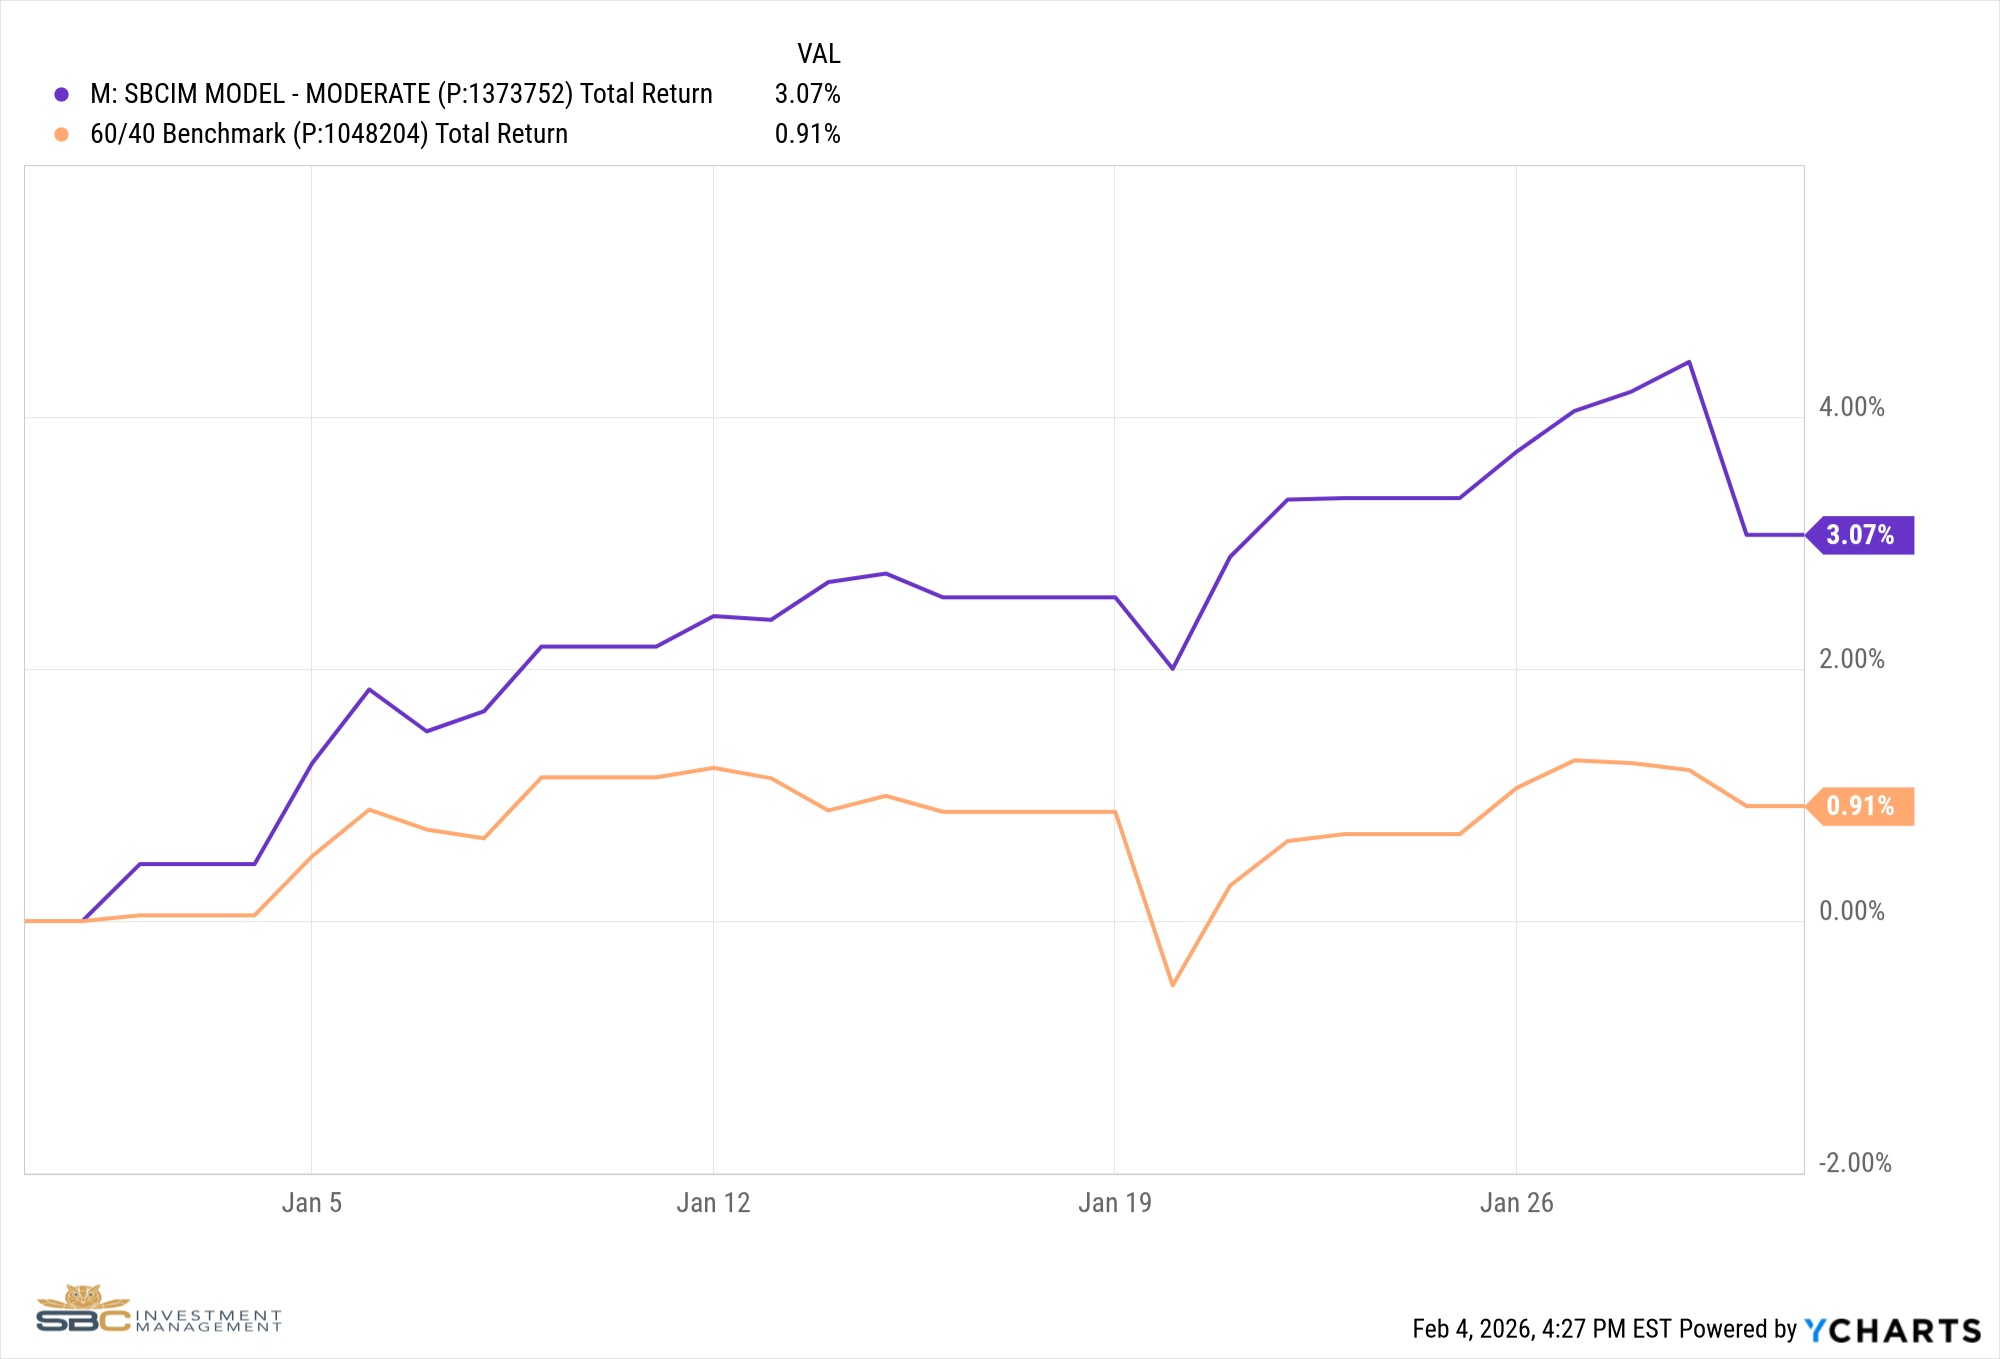
Our Moderate Model Portfolio returned 3.07% in January and has returned 3.07% YTD
Changes to the model portfolio in January
1/16/2026
- Sold all MGK (Mega Cap Growth), all XLY (Consumer Discretionary), and some QQQ (Technology) in Sat 1
- Bought KWEB (China), KRE (Regional Banks), XLF (Financials), IWC (Microcap), and EEM (Emerging Markets) in Sat 1
- Swapped MGK (Mega Cap Growth) for CVX (Chevron) in Sat 4
1/23/2026
- Reduced QQQ (Tech) Exposure, Added XRT (Retail) and JPXN (Japan) in Sat 1
1/28/2026
Removed XLV (Healthcare) and added PCSD (Small Cap Consumer Discretionary) in Sat1
January Performance with Benchmark
If you were to have any questions regarding the above please reach out to us to set up a one to one meeting to review your situation.
Sincerely,
Bryant Andrus, MSF, CFP®
President
SBC Investment Management
P: (602) 641-5996
M: (319) 520-2033
E: bandrus@sbcinvestmentmanagement.com
Jake Rehkop
Investment Analyst, Junior Portfolio Manager
SBC Investment Management
P: (435) 775-2950
M: (435) 590-8317
E: jrehkop@sbcinvestmentmanagement.com
DISCLAIMERS
SBC Investment Management’s Monthly and Quarterly Market Summary and Outlook is intended to communicate current economic and capital market information along with the informed perspectives of our investment professionals. All expressions of opinion are subject to change. Past performance may not be indicative of future results. There is no assurance that any of the trends discussed will continue, or that any of the forecasts will occur.
You should not construe any information in this publication as investment, financial, or any other professional advice. Nothing contained in this publication constitutes a recommendation, endorsement, or an offer to buy or sell any securities or other financial instruments. You should conduct your own research or speak to your investment advisor before investing.
SBC Investment Management prepares this material as a resource for its clients. This content is for informational purposes only and does not address the circumstances of any particular individual or entity. You may contact us to discuss the content of this publication within the context of your own financial situation.
Past performance may not be indicative of future results. Different types of investments involve varying degrees of risk. There can be no assurance that the future performance of any specific investment, investment strategy (including the investments and/or investment strategies recommended or undertaken by SBC Investment Management, LLC), or any non-investment related content, referred to directly or indirectly in this piece will be profitable, equal any corresponding indicated historical performance level(s), or prove successful. Due to various factors, including changing market conditions and/or applicable laws, the content may no longer be reflective of current opinions or positions. Moreover, you should not assume that any discussion or information contained in this piece serves as the receipt of, or as a substitute for, personalized investment advice from SBC Investment Management, LLC. Investment performance results published herein do not include investment advisory fees paid, or any other related account expenses. Performance results compiled solely by SBC Investment Management, LLC, have not been independently verified, and do not reflect the impact of taxes on non-qualified accounts.
Historical performance results for investment indices (provided for general comparison purposes only), strategies, models and/or indicators generally do not reflect the deduction of an investment management fee, nor the impact of taxes, the incurrence of which would have the effect of decreasing historical performance results. It should not be assumed that your account holdings correspond directly to any comparative indices.
Our past recommendations and model portfolio results are not a guarantee of future results. Using any graph, chart, formula, or other device to assist in deciding which securities to trade or when to trade them presents many difficulties and their effectiveness has significant limitations, including that prior patterns may not repeat themselves continuously or on any particular occasion. In addition, market participants using such devices can impact the market in a way that changes the effectiveness of such device.
Hypothetical performance results shown in this report and on sbcinvestmentmanagement.com are backtested and do not represent the performance of any account managed by SBC Investment Management, LLC. They were achieved by means of the retroactive application of each of the previously referenced models, certain aspects of which may have been designed with the benefit of hindsight.
The hypothetical backtested performance does not represent the results of actual trading using client assets nor decision-making during the period and does not and is not intended to indicate the past performance or future performance of any account or investment strategy managed by SBC Investment Management, LLC. If actual accounts had been managed throughout the period, ongoing research might have resulted in changes to the strategy, which might have altered returns. The performance of any account or investment strategy managed by SBC Investment Management, LLC will differ from the hypothetical backtested performance results for each factor shown herein for a number of reasons, including without limitation the following:
Although SBC Investment Management, LLC may consider from time to time one or more of the factors noted herein in managing any account, it may not consider all or any of such factors. SBC Investment Management, LLC may (and will) from time to time consider factors in addition to those noted herein in managing any account.
SBC Investment Management, LLC may rebalance an account more frequently or less frequently than annually and at times other than presented herein.
The hypothetical backtested performance results for each strategy include estimated values for transaction costs of buying and selling securities, which may not be accurate. Investment management fees, custody and other costs, and taxes – all of which would be incurred by an investor in any account managed by SBC Investment Management, LLC are not included in performance results. If such costs and fees were reflected, the hypothetical backtested performance results would be lower.
The hypothetical performance does not reflect the reinvestment of dividends and distributions therefrom, interest, capital gains and withholding taxes.
Accounts managed by SBC Investment Management, LLC are subject to additions and redemptions of assets under management, which may positively or negatively affect performance depending generally upon the timing of such events in relation to the market’s direction.
Simulated returns may be dependent on the market and economic conditions that existed during the period. Future market or economic conditions can adversely affect the returns.
SBC Investment Management, LLC is neither a law firm nor a certified public accounting firm. No portion of our website, our newsletter content, or any other correspondence from us should be construed as legal or accounting advice.