
Geopolitics, Energy, and Portfolio Resilience
TL;DR
Geopolitical tensions set the tone for markets this past week, with rising Middle East tensions and Red Sea shipping disruptions lifting oil prices.
Our base case for the months ahead remains constructive (growth accelerating and inflation cooling), but the range of outcomes is wider than it was a few months ago.
We manage risk with a repeatable macro process, including the Hedgeye Quad framework: we entered 2026 positioned for Quad 1 (growth accelerating, inflation decelerating) and headed into March anticipated a shift toward Quad 3 (growth slowing, inflation accelerating), prompting incremental trims and added energy exposure.
We see this as a volatility shock worth respecting, but not a reason to overhaul a long-term plan.
Portfolio risk management is typically incremental: stay diversified, size hedges carefully, and trim exposures where risk has built up.
Because headlines are unpredictable, process matters more than prediction.
Market Context
Geopolitics, not economic data, drove markets over the past week. Tensions in the Middle East and disruptions to shipping routes through the Red Sea pushed energy prices higher. Brent crude rose more than 10% in early March as investors priced in a higher “war premium” in oil.
This comes at a sensitive point in the cycle. In December, our signals and the Hedgeye Quad framework suggested a constructive Quad 1 setup for January and February, where inflation tends to decelerate as growth accelerates. We also entered March expecting a shift toward Quad 3, where inflation tends to accelerate as growth decelerates, an environment that often benefits energy and other inflation-sensitive exposures.
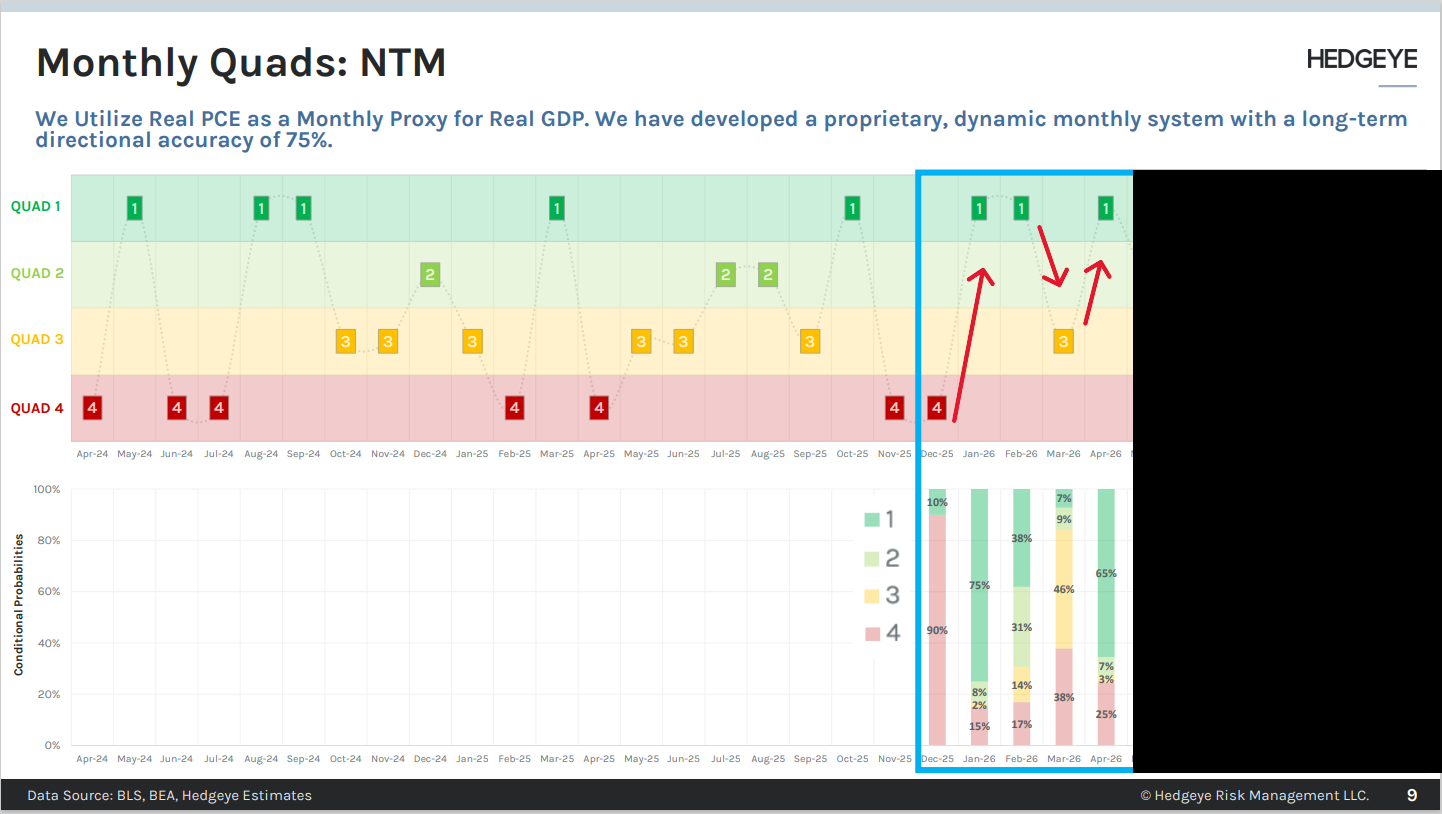
Bottom line: our base case is still reasonable; growth is positive, inflation is trending lower from its pandemic highs, and central banks are closer to easing than tightening. In our process, that aligns more with a Quad 1-style backdrop, which we expect to re-emerge after March. But with geopolitics, energy, and supply-chain risks in the mix, the range of possible outcomes is wider than it was a few months ago. For investors, the goal isn’t to predict each headline; it’s to build portfolios that can hold up across different Quad regimes and when geopolitical risk rises.
Our View: A Volatility Spike, Not a New Playbook
Recent Middle East developments look like a volatility shock, which is important, but not a reason to “sell everything.” We treat geopolitical risk, especially in energy, as a recurring feature of markets, not a one‑time surprise. Energy supply routes have always been exposed to geopolitical events, and the Middle East remains central to global oil and LNG flows.
For portfolios, that means we assume these shocks will happen again, and we plan for them.
Use energy and real-asset exposures thoughtfully as partial hedges (not as a “bet the farm” position).
Make measured risk adjustments when markets reprice risk quickly.
Keep emphasizing diversification and drawdown management, topics we covered in January (risk-adjusted returns) and February (concentration risk).
Energy: what we’re watching, and what it signals
Oil can reprice quickly because markets must handicap a few high-impact questions in real time: Will the disruptions be temporary? Will key shipping lanes and chokepoints remain impaired? Could the situation broaden into a more sustained supply risk? [5] Even when global production is unchanged, bottlenecks and a higher risk premium can lift prices fast, and that can flow through to inflation expectations and broader volatility [1].
Two practical takeaways:
Oil is often the first “tell.” In geopolitical flare-ups, crude typically reacts quickly, which can spill into inflation expectations and overall volatility.
Chokepoints can matter more than supply. Disruptions near the Red Sea/Suez can raise shipping and insurance costs and tighten refined products even if global production is unchanged.
We try not to overreact to headline-driven spikes because, in markets, risk appetites can change quickly. “Indiscriminate de-risking” means selling broadly, reducing exposure across many assets at once, without distinguishing between what is directly impacted and what is not. This kind of blanket selling can lock in poor prices during fast-moving events. That’s why our adjustments tend to be incremental: we keep a diversified core, trim where risk has built up, and use targeted tilts (for example, modest energy exposure when inflation expectations rise) rather than making all-in or all-out moves. Over time, it is precisely these marginal shifts that compound into meaningful advantages. By consistently avoiding the performance drag of panic-driven selling and capturing selective opportunities as they arise, the portfolio is positioned to deliver stronger risk-adjusted returns across full market cycles, not just in any single moment.
Inflation, Interest Rates, and “How Long Does This Last?”
The big macro question is whether higher energy prices stay elevated long enough to slow the disinflation trend that has helped risk assets. The IMF (International Monetary Fund) still expects global inflation to decline through 2026, but notes that energy shocks and renewed supply disruptions could delay the return to target, especially in the U.S. [3]
From a portfolio standpoint, we watch three channels:
1. Headline vs. core inflation: Energy hits headline inflation quickly, but it takes longer to show up in core measures. A short-lived spike may not change the Fed’s path much; a prolonged spike could slow or delay rate cuts. [3] [6]
2. Growth tradeoffs: A large, sustained rise in oil can act like a tax on consumers and energy-importing economies. Smaller moves may be absorbed if income growth and labor markets remain healthy. [1] [5]
3. Risk premium across assets: When inflation and policy become less predictable, markets often demand more compensation for risk, pressuring both credit and equities, even if the ultimate economic impact is limited.
Because no one can reliably forecast conflicts, oil prices, or central-bank timing, process matters more than prediction. We use tools like the Hedgeye Quad framework to stress-test portfolios across different growth and inflation regimes, and we make incremental adjustments based on what the data is signaling. The goal isn’t to bet on a single forecast; it’s to position toward areas where the probability-weighted outcomes look most favorable while keeping portfolios resilient if a different regime shows up.
Portfolio Positioning: Hedging Without Overreacting
This environment connects to the themes we’ve emphasized in recent letters:
January: Why limiting drawdowns improve long-term compounding.
February: Why reducing concentration (including the “Magnificent Seven”) matters as leadership broadens.
Energy-driven volatility can affect both drawdowns and diversification.
First, energy and real assets can help in certain scenarios (for example, if inflation re-accelerates due to supply disruption). But they are not a “free hedge.” Energy equities can be volatile, and commodity-linked exposures can introduce their own cyclicality, so sizing and diversification still matter.
Second, volatile periods can push investors toward extremes: some will stay fully exposed no matter what, while others will move aggressively to cash. Both can be costly:
Staying fully exposed can hurt if shocks persist or broaden.
Going all the way to cash can create a large “miss risk” if volatility fades and markets rebound.
Our approach is to trim risk where it has built up, not abandon risk entirely. During February, we realized gains in some long-held positions and modestly reduced select equity exposures where valuations and position sizes had expanded, steps that also made sense heading into an expected March Quad 3 (slower growth, faster inflation). At the same time, we added incrementally to areas like energy that have historically held up better in Quad 3. This wasn’t us “predicting” a specific geopolitical event; it was the result of following a repeatable signal-driven process and positioning ahead of time for the macro regime our framework was indicating.
In practical terms, that means:
Keeping a diversified equity core that is not overly concentrated in any single sector, factor, or region.
Using satellites to express more targeted views in areas like energy, industrials, or selected international markets, while sizing them within a disciplined risk budget.
Maintaining enough flexibility, through a combination of cash reserves, high-quality fixed income, and liquid satellite positions, to respond if risk premiums widen further.
Investor Takeaways
Here are the main points we want investors to take away from this newsletter:
1. Geopolitical shocks happen. Energy disruptions, shipping bottlenecks, and conflict-driven price spikes are recurring features of markets. We don’t build portfolios that require “calm conditions” to work.
2. Energy can help in some scenarios, but it’s not a cure-all. Energy exposure may cushion certain outcomes and amplify others. Diversification and disciplined sizing matter more than trying to find one perfect hedge.
3. Risk management is usually incremental. The decision is rarely “all in” or “all out.” Trimming extended positions and taking some gains into strength can improve resilience without giving up long-term return objectives.
4. Stick to a repeatable process. We can’t forecast every conflict, oil move, or policy decision. We can monitor risk, stress-test portfolios, and adjust exposures when the balance of risk and reward changes.
As always, the objective isn’t to eliminate volatility. The goal is to manage risk thoughtfully, preserve capital when conditions deteriorate, and maintain enough exposure to participate when markets stabilize.
Sources
1. World Economic Outlook Update, January 2026: Global Economy: Steady amid Divergent Forces
2. Oil Shipping vulnerability in the Middle East and 2026 Price Risks
3. Finscann - Real-Time Financial News & Market Insights
4. Oil Prices Surge on Middle East Military Tensions
5. The $108 oil risk: How Middle East tensions could rock the world economy - The HinduBusinessLine
6. Oil Prices Surge 3.7% as U.S.-Iran Standoff Triggers Higher 2026 Forecasts | OilPrice.com
Model Performance Update
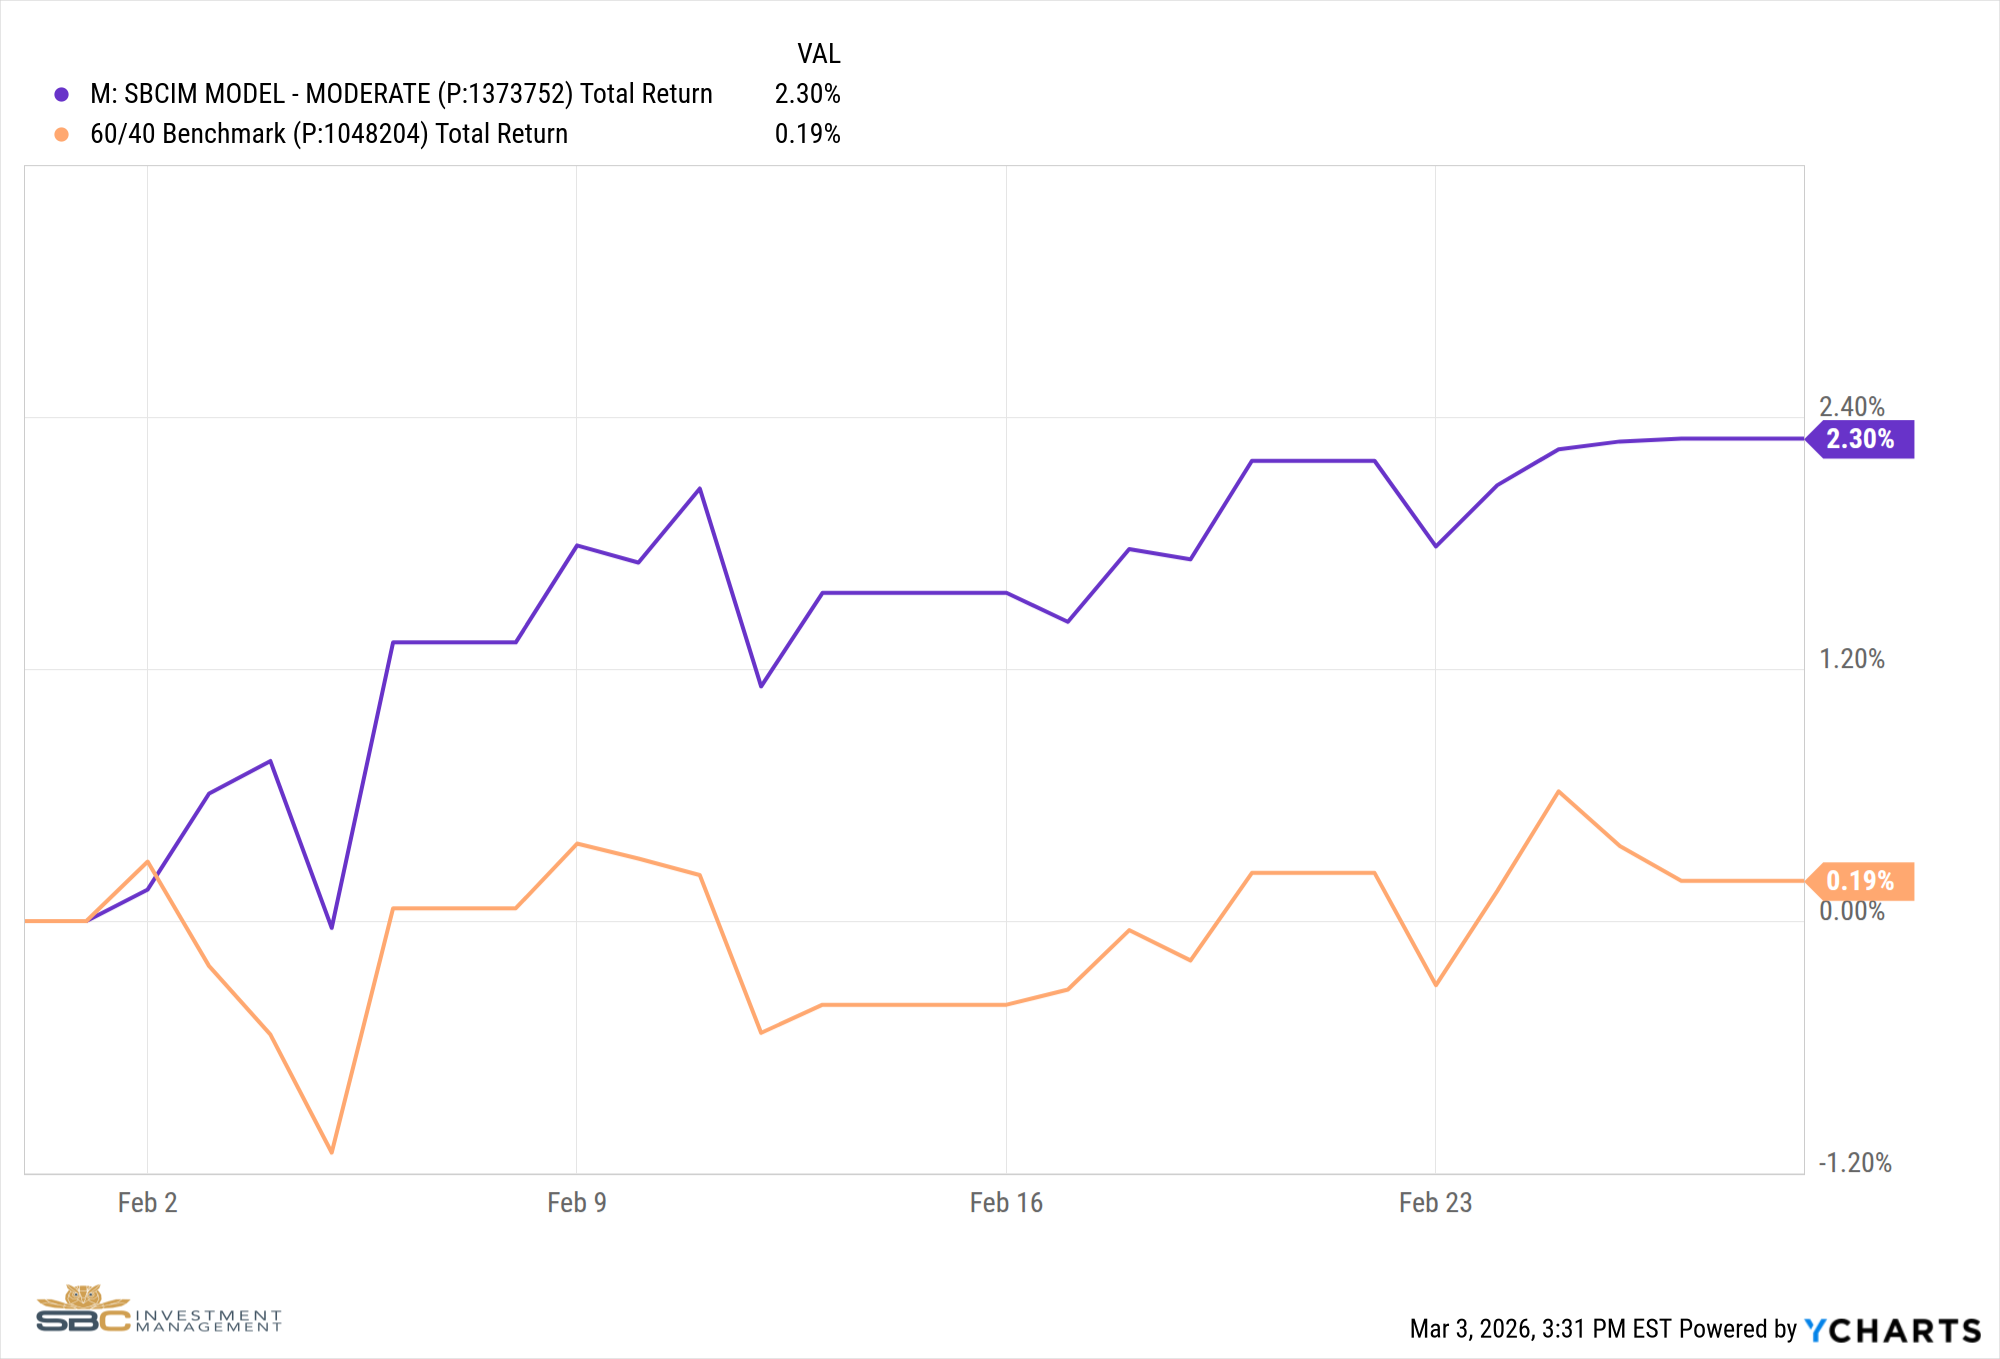
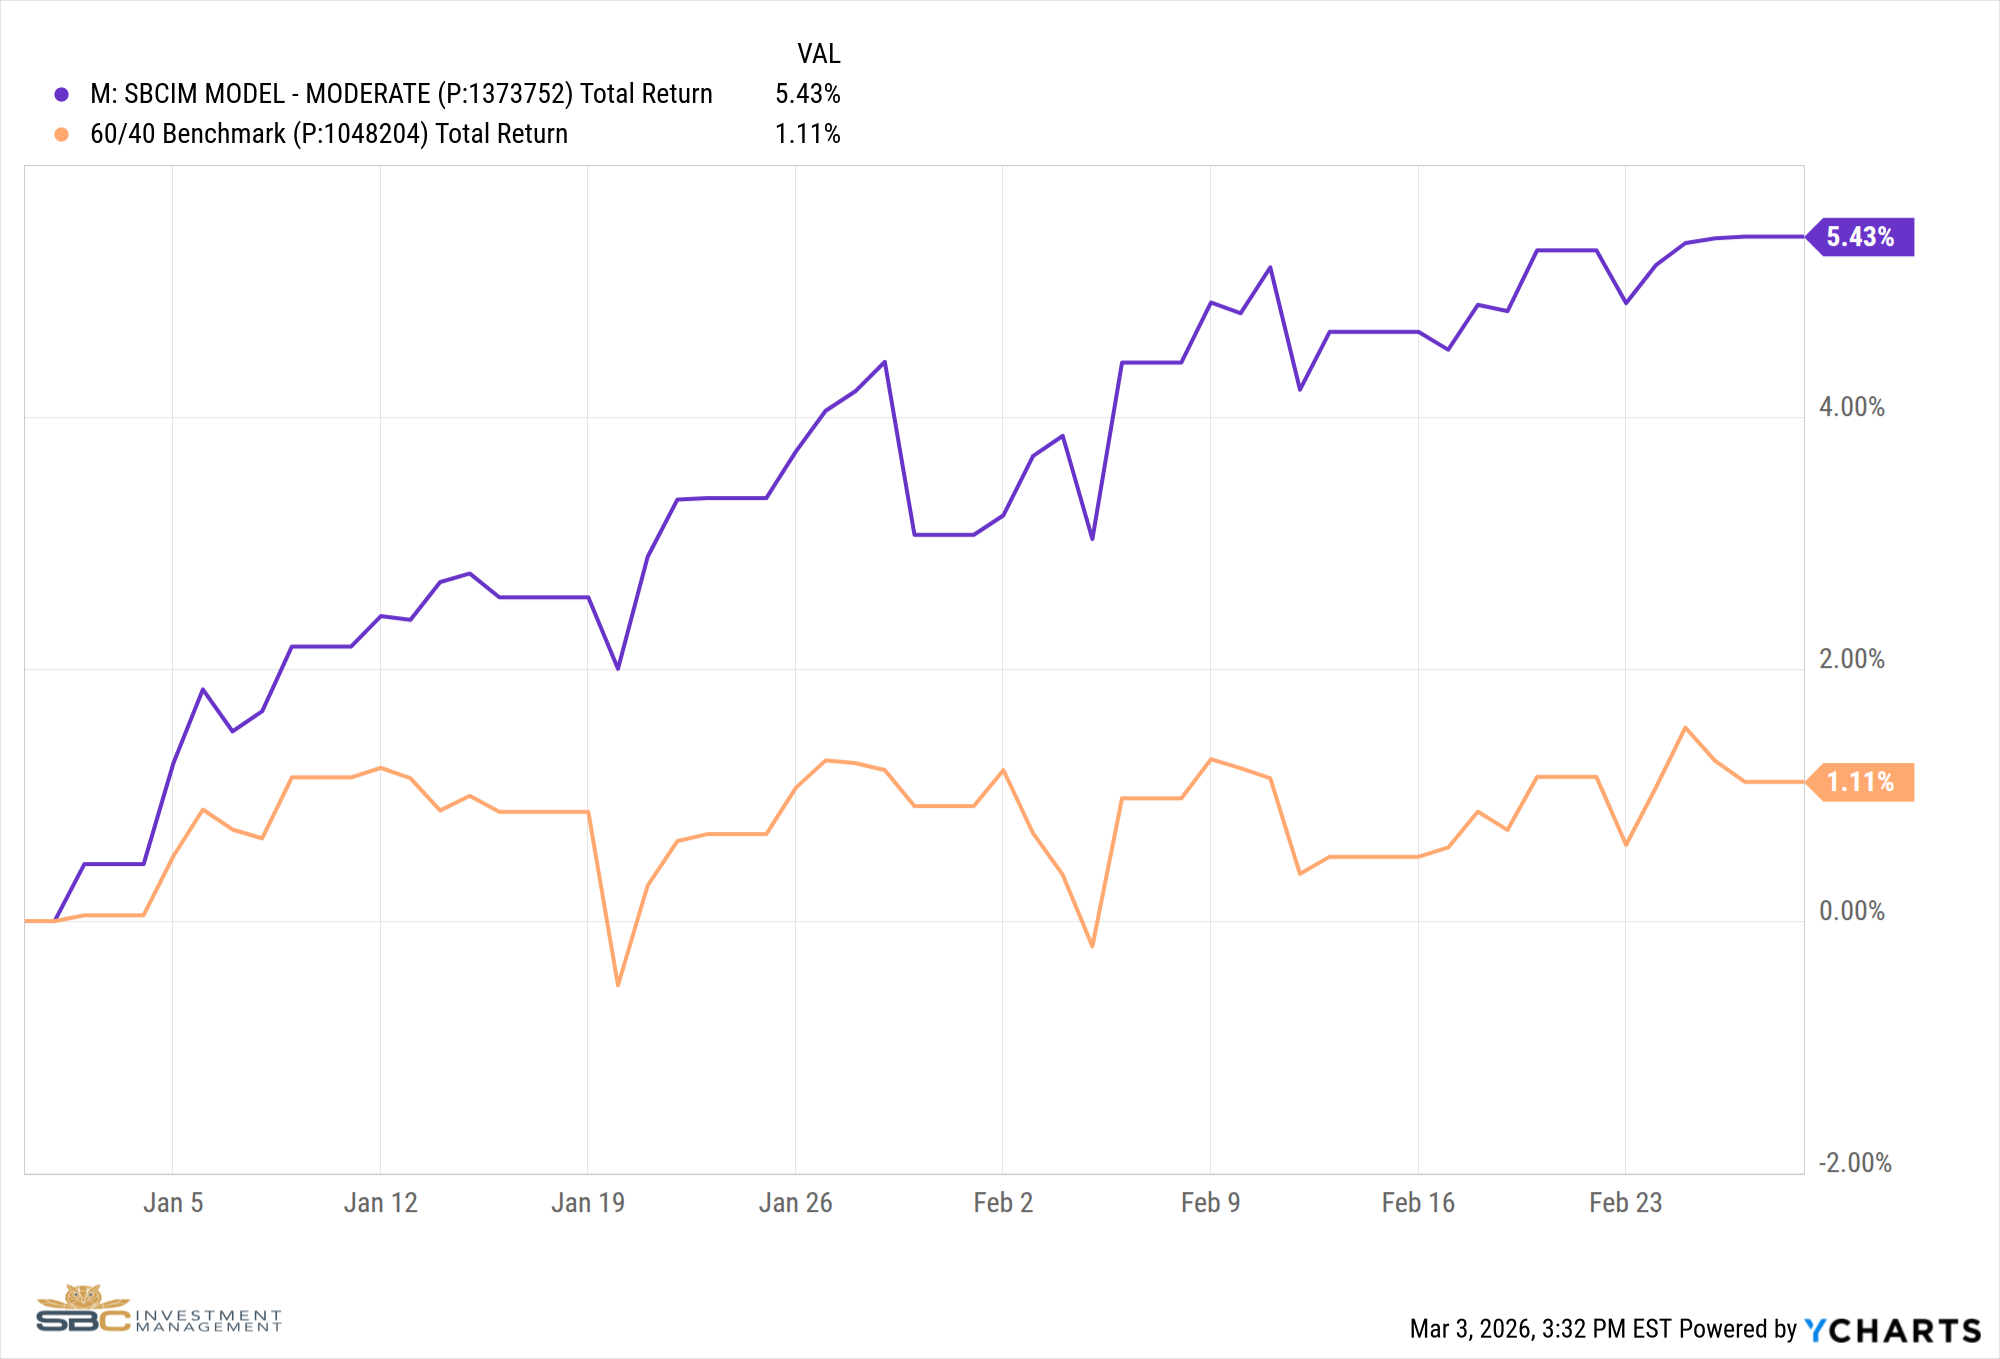
Our Moderate Model Portfolio returned 2.3% in February and has returned 5.43% YTD
Changes to the model portfolio in February
DATE:
2026-02-03
CHANGE:
Removed KWEB (China) and added XOP (Oil Exploration) in Satellite 1.
Removed PINK (Healthcare) and increased exposure to EEM (Emerging Markets) in Satellite 1.
DATE:
2026-02-12
CHANGE:
Removed PSCD (Consumer Discretionary) and XLF (Financials) in Satellite 1.
Reduced XLI (Industrials) and IWM (Small Cap) in Satellite 1.
Increased exposure to XOP (Oil Exploration) in Satellite 1.
Removed SIVR (Silver) and CPER (Copper) in Satellite 3.
Increased total cash position by 2.5%.
DATE:
2026-02-17
CHANGE:
Removed IWC (Microcap) from Satellite 1.
DATE:
2026-02-18
CHANGE:
Added ITB (Home Construction) to Satellite 1.
DATE:
2026-02-24
CHANGE:
Removed XRT (Retail) and KRE (Regional Banks) from Satellite 1
Added FXC (Canadian Dollar) to Satellite 3
February Performance with Benchmark
Year-to-Date Performance with Benchmark
If you have any questions about the above, please reach out to us to set up a one-to-one meeting so we can review your situation.
Sincerely,
Bryant Andrus, MSF, CFP®
President
SBC Investment Management
P: (602) 641-5996
M: (319) 520-2033
E: bandrus@sbcinvestmentmanagement.com
Jake Rehkop
Investment Analyst, Junior Portfolio Manager
SBC Investment Management
P: (435) 775-2950
M: (435) 590-8317
E: jrehkop@sbcinvestmentmanagement.com
DISCLAIMERS
SBC Investment Management’s Monthly and Quarterly Market Summary and Outlook is intended to communicate current economic and capital market information along with the informed perspectives of our investment professionals. All expressions of opinion are subject to change. Past performance may not be indicative of future results. There is no assurance that any of the trends discussed will continue, or that any of the forecasts will occur.
You should not construe any information in this publication as investment, financial, or any other professional advice. Nothing contained in this publication constitutes a recommendation, endorsement, or an offer to buy or sell any securities or other financial instruments. You should conduct your own research or speak to your investment advisor before investing.
SBC Investment Management prepares this material as a resource for its clients. This content is for informational purposes only and does not address the circumstances of any particular individual or entity. You may contact us to discuss the content of this publication within the context of your own financial situation.
Past performance may not be indicative of future results. Different types of investments involve varying degrees of risk. There can be no assurance that the future performance of any specific investment, investment strategy (including the investments and/or investment strategies recommended or undertaken by SBC Investment Management, LLC), or any non-investment related content, referred to directly or indirectly in this piece will be profitable, equal any corresponding indicated historical performance level(s), or prove successful. Due to various factors, including changing market conditions and/or applicable laws, the content may no longer be reflective of current opinions or positions. Moreover, you should not assume that any discussion or information contained in this piece serves as the receipt of, or as a substitute for, personalized investment advice from SBC Investment Management, LLC. Investment performance results published herein do not include investment advisory fees paid, or any other related account expenses. Performance results compiled solely by SBC Investment Management, LLC, have not been independently verified, and do not reflect the impact of taxes on non-qualified accounts.
Historical performance results for investment indices (provided for general comparison purposes only), strategies, models and/or indicators generally do not reflect the deduction of an investment management fee, nor the impact of taxes, the incurrence of which would have the effect of decreasing historical performance results. It should not be assumed that your account holdings correspond directly to any comparative indices.
Our past recommendations and model portfolio results are not a guarantee of future results. Using any graph, chart, formula, or other device to assist in deciding which securities to trade or when to trade them presents many difficulties and their effectiveness has significant limitations, including that prior patterns may not repeat themselves continuously or on any particular occasion. In addition, market participants using such devices can impact the market in a way that changes the effectiveness of such device.
Hypothetical performance results shown in this report and on sbcinvestmentmanagement.com are backtested and do not represent the performance of any account managed by SBC Investment Management, LLC. They were achieved by means of the retroactive application of each of the previously referenced models, certain aspects of which may have been designed with the benefit of hindsight.
The hypothetical backtested performance does not represent the results of actual trading using client assets nor decision-making during the period and does not and is not intended to indicate the past performance or future performance of any account or investment strategy managed by SBC Investment Management, LLC. If actual accounts had been managed throughout the period, ongoing research might have resulted in changes to the strategy, which might have altered returns. The performance of any account or investment strategy managed by SBC Investment Management, LLC will differ from the hypothetical backtested performance results for each factor shown herein for a number of reasons, including without limitation the following:
Although SBC Investment Management, LLC may consider from time to time one or more of the factors noted herein in managing any account, it may not consider all or any of such factors. SBC Investment Management, LLC may (and will) from time to time consider factors in addition to those noted herein in managing any account.
SBC Investment Management, LLC may rebalance an account more frequently or less frequently than annually and at times other than presented herein.
The hypothetical backtested performance results for each strategy include estimated values for transaction costs of buying and selling securities, which may not be accurate. Investment management fees, custody and other costs, and taxes – all of which would be incurred by an investor in any account managed by SBC Investment Management, LLC are not included in performance results. If such costs and fees were reflected, the hypothetical backtested performance results would be lower.
The hypothetical performance does not reflect the reinvestment of dividends and distributions therefrom, interest, capital gains and withholding taxes.
Accounts managed by SBC Investment Management, LLC are subject to additions and redemptions of assets under management, which may positively or negatively affect performance depending generally upon the timing of such events in relation to the market’s direction.
Simulated returns may be dependent on the market and economic conditions that existed during the period. Future market or economic conditions can adversely affect the returns.
SBC Investment Management, LLC is neither a law firm nor a certified public accounting firm. No portion of our website, our newsletter content, or any other correspondence from us should be construed as legal or accounting advice.