
Unprecedented times or not?
July 2024 was marked by significant shifts in investor sentiment and market dynamics. The month saw a notable rotation from large-cap technology stocks to value and small-cap stocks, driven by changing expectations regarding Federal Reserve policies and economic indicators.
Key Highlights
S&P 500: The index rose by 1.1% in July, bringing its year-to-date gain to 14.5%[1].
Dow Jones Industrial Average: Increased by 4.4% for the month [1].
Nasdaq Composite: Declined by 0.8% in July, reflecting the shift away from tech stocks[1].
Russell 2000: Small-cap stocks surged, with the index gaining 10.7% in July [1].
Market Dynamics
Rotation to Value and Small-Caps: Investors began reallocating funds from large-cap tech stocks to value and small-cap stocks. This "Great Rotation" was influenced by expectations of potential Federal Reserve rate cuts later in the year1 [2] [3].Tech Stock Decline: The largest tech stocks, which had driven market gains earlier in the year, saw declines. The Nasdaq-100, heavily weighted in tech, fell by 1.5% [1] [3].
Economic Indicators
Inflation: Continued to cool, with consumer prices unexpectedly declining in June, which bolstered expectations for rate cuts [2] [3].
Labor Market: Showed signs of weakening, although the overall economic growth remained steady. The unemployment rate was expected to remain unchanged at 4.1%[2].
GDP Growth: The U.S. economy showed better-than-expected growth in Q2 2024, supporting the optimistic sentiment in the market [2].
Outlook Equities
The market sentiment for the remainder of 2024 remains cautiously optimistic. The rotation into value and small-cap stocks suggests a broader market participation beyond the tech sector. However, risks remain, including potential economic slowdowns, geopolitical uncertainties, and the sustainability of the small-cap rally. Investors are advised to remain vigilant and consider diversification to manage potential volatility.
In summary, July 2024 was a transformative month for the stock market, characterized by a significant shift from tech to value and small-cap stocks, driven by changing economic indicators and expectations of Federal Reserve policy adjustments.
Bond Market Summary for July 2024
July 2024 was a dynamic month for the bond market, characterized by declining yields and increased investor interest in both government and corporate bonds. The Federal Reserve's decision to hold interest rates steady played a significant role in shaping market movements.
Key Highlights
US Treasury Yields: The benchmark 10-year Treasury yield fell for the third consecutive month, ending July at 4.05%, marking its longest streak of declines in three years [4][3]. This decline in yields was driven by expectations of potential rate cuts later in the year as inflation showed signs of cooling[4] [5].
Federal Reserve Policy: The Federal Reserve kept its benchmark interest rate unchanged at 5.25%-5.5% during its July meeting. The Fed noted progress towards its 2% inflation target but did not signal an imminent rate cut, maintaining a cautious stance [5].
Government Bonds
- US Treasuries: The decline in yields across various maturities reflected investor confidence in the Fed's ability to manage inflation. The bond market's performance was buoyed by expectations of a more dovish monetary policy stance in the near future [4] [5].
- European Bonds**: In Europe, bond auctions in France and the UK showed robust demand. France's July 18 bond auction for 3-year, 5-year, and 8-year notes fetched healthy bid-to-cover ratios, indicating strong investor interest despite political uncertainties[6].
Corporate Bonds
- High-Yield Bonds: US high-yield bonds posted positive returns, outperforming government bonds as investors sought higher yields amid a stable economic outlook4. The correlation between stock and bond returns remained high, reflecting the broader market's response to economic data and Fed policies[7].
Economic Indicators
- Inflation: Continued to moderate, with consumer prices showing unexpected declines in June. This bolstered expectations for potential rate cuts by the Fed, contributing to lower yields [4] [5].
- GDP Growth: The US economy grew at an annualized rate of 2.8% in the second quarter, driven by consumer and government spending, which supported bond market stability [5].
- Labor Market: Showed signs of softening, with the unemployment rate remaining at 4.1%. This was seen as a potential indicator for future Fed rate cuts, further influencing bond yields [5].
Commentary:
Overall, July was an eventful and disjointed month. From the attempted assassination of the Republican Presidential Candidate, Donald Trump, to the stepping down from the presidential election of the current president, Joe Biden, you would be surprised to hear that the S&P 500 finished the month up 1.1%.
Most would think those sorts of headlines would create a lot of upheaval and uncertainty in the markets, myself included. People who listen to me talk know that I have been talking about the risk in the market generated by the disconnect between economic data and stock market performance for the past 12-18 month. We have seen this dance before, ’07 – ’08, Dot Com bubble, etc. to name a few. The price of a stock or bond is routed in how well the company is making money and/or public perception.
What we are seeing in the first few days of August feels very similar to other times the market has corrected when the stock market realizes that the underlying economic conditions are finally catching up.
As we look ahead in the markets, there's a lot of near-term uncertainty. For many months, we have had indicators telling us that everything will be higher for longer: inflation, stock market, interest rates, etcetera. But there is an underlying current that has been persistent for the last 12 plus months that not all's well in the market. As we look at the Quads provided by our friends at Hedgeye, we can see that the projection for the 3rd Quarter of 2024 is expected to be a narrow Quad 4. As seen below, Quad 4 is characterized by both decelerating growth and inflation. With this decelerating growth, the risk to the downside in equities is still not insignificant.

As we look back at interest rates, we see that in the 4th quarter of 2023 interest rates were declining significantly. As we entered the first half of 2024, we saw rates tick back up again. This caused the bond market to only price in 1 industry cut compared to 6th that they were originally talking about entering 2024. This was a result of economic indicators pointing towards the idea that both Growth and Inflation were going to stay higher for longer than originally expected. As we get deeper into this Quad 4 environment, do not be surprised if the talks of multiple rate cuts begin to pick back up with the bond market responding accordingly.
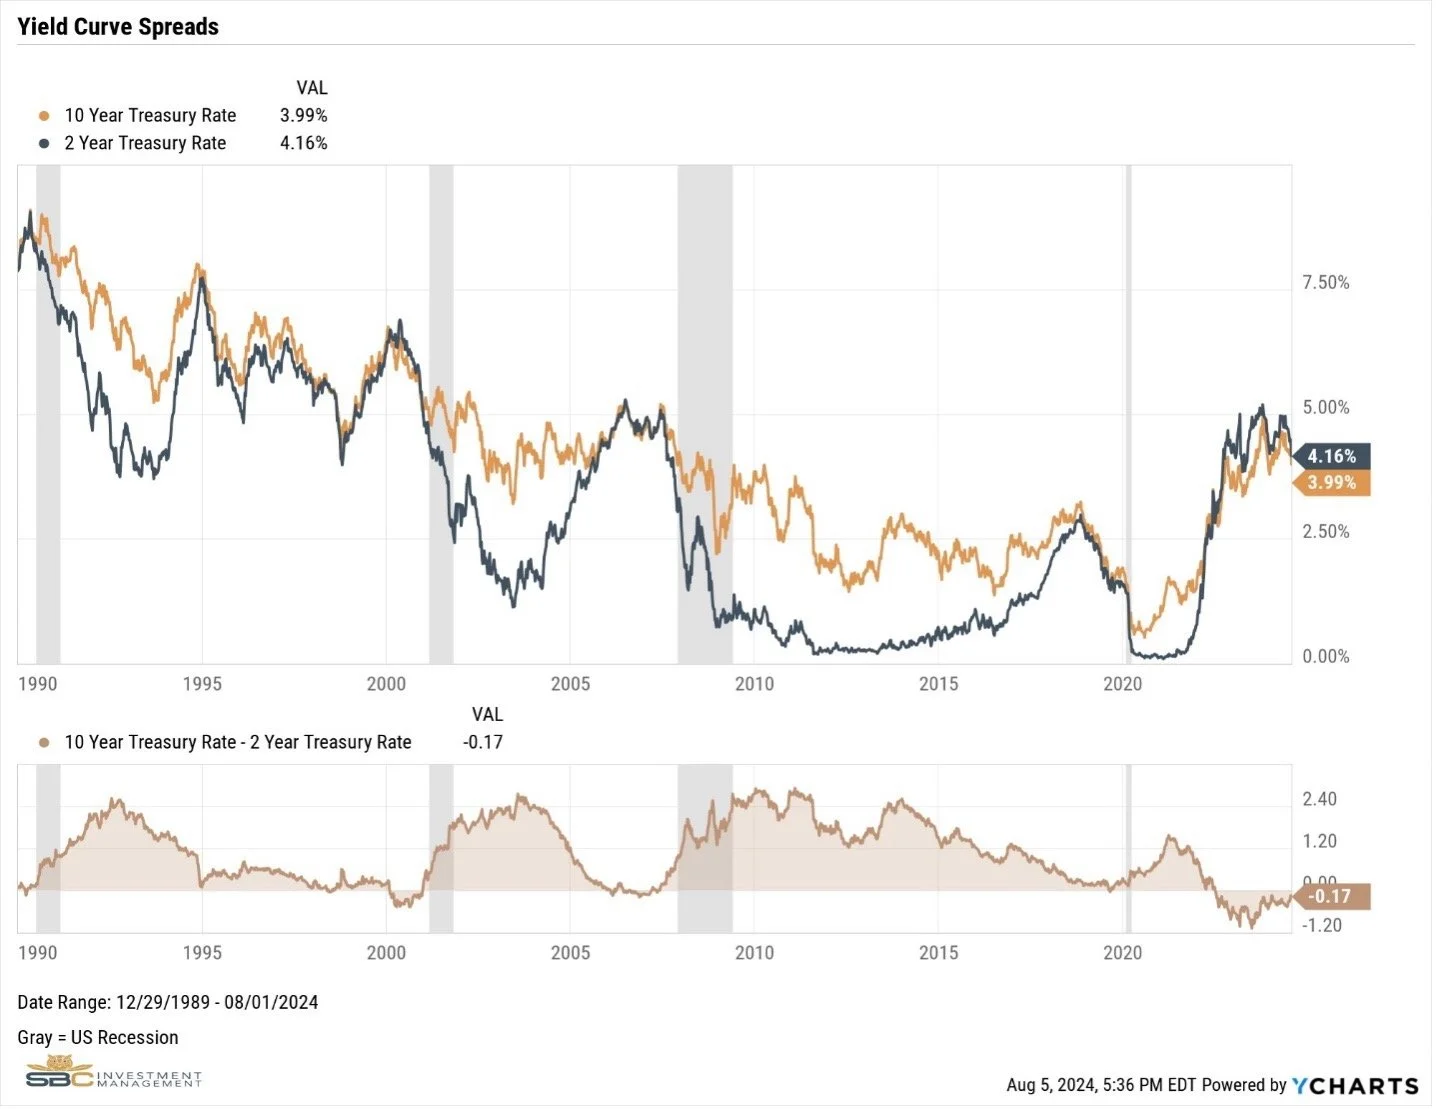
For bonds, the yield curve remains inverted. For many years, the yield curve has been used by investors to indicate a recession in the United States. Most believe it is the inversion of the yield curve itself, that signals recession. However, as you can see in this chart dating back to 1990, it is not the inversion of the yield curve, but rather the reversal of the yield curve inversion that has sparked the beginning of previous recessions. This reversal of the inversion has not yet happened, however with economic growth slowing and the odds of multiple rate cuts in 2024 increasing, we are beginning to see early evidence of the potential inversion reversal.
Conclusion:
Earlier in the month of July we started making some shifts within our satellites to prepare for the uncertainty that lie ahead. We have been paying very close attention to making sure we have the right risk matrix was in the portfolios to account for as many scenarios as possible. We have been tightening up our deviations from our target weights among our portfolio and eliminating some positions based on their trends in the market.
When we have volatility in the market it is critically important to follow a disciplined approach. This is where portfolio managers can the help the average investors stay on point. A great book that I read when I was an undergraduate student was called “Beyond Greed and Fear.” In this book the authors talked about getting away from rule of thumb or focusing on the headline news nor chasing the hottest thing in the news. Experience has shown us over and over that we cannot accurately predict which way the stock market or bond market is going to go on any given day, month, year. Thus having a well disciplined research based approach is key to weather the storms (volatility).
However, there is some art that goes into portfolio management. Being able to separate the noise from facts were economic data and being able to make tactical shifts to protect the downside is critically important. Our approach to the market always has been a core scientific approach in which we have the right asset allocation based risk tolerance, your goals and objectives, as well as a lot of data-driven scientific research. We have overlaid this with our tactical allocation among various satellites. These tactical alterations enhance the scientific approach our core holdings and can augment the returns or create downside protection.
One of the satellites is in the alternative investments. The alternative investments we have right now allocated is managed futures. Managed futures is one of the asset classes that is countercyclical to the market at large. In times of crisis some assets classes that should not move together do. We've seen this in in March and April of 2020, we saw it in 2008 crash, we observed this in 2001 crash. Because of this correlation in extreme times managed futures provide us a shock absorber for this extreme volatility.
Over the last two years managed futures have been a drag on a portfolio because when everything is going well managed futures tend to drift to the negative return arena. But just like an insurance policy that cost you your annual premiums when you need it you
[1] https://www.morningstar.com/news/marketwatch/20240731956/these-sp-500-stocks-fell-the-most-in-july-as-the-great-rotation-began
[2] https://www.nasdaq.com/articles/july-2024-review-and-outlook
[3] https://www.investopedia.com/july-2024-stock-market-wrap-tech-small-caps-8686296
[4] https://us.etrade.com/knowledge/library/perspectives/market-happenings/monthly-perspectives-august-2024
[5] https://www.cnbc.com/2024/07/31/fed-rate-decision-july-2024.html
[6] https://www.jpmorgan.com/insights/outlook/economic-outlook/economic-trends
[7] https://www.proshares.com/browse-all-insights/insights-commentary/market-commentary-july-2024
Model Performance Update
Our Moderate model portfolio returned 1.74% during the Month of July and finished the month up 7.38% Year to Date (see chart below).
Changes to the model portfolio in July
Added BBN, VWOB, IVOL, and LQD
Sold all UUP in client accounts.
July 2024 performance with benchmark

July 2024 YTD performance with benchmark

If you were to have any questions regarding any of the above please reach out to us to set up a one to one meeting to review your situation.
DISCLAIMERS
SBC Investment Management’s Monthly and Quarterly Market Summary and Outlook is intended to communicate current economic and capital market information along with the informed perspectives of our investment professionals. All expressions of opinion are subject to change. Past performance may not be indicative of future results. There is no assurance that any of the trends discussed will continue, or that any of the forecasts will occur.
You should not construe any information in this publication as investment, financial, or any other professional advice. Nothing contained in this publication constitutes a recommendation, endorsement, or an offer to buy or sell any securities or other financial instruments. You should conduct your own research or speak to your investment advisor before investing.
SBC Investment Management prepares this material as a resource for its clients. This content is for informational purposes only and does not address the circumstances of any particular individual or entity. You may contact us to discuss the content of this publication within the context of your own financial situation.
Past performance may not be indicative of future results. Different types of investments involve varying degrees of risk. There can be no assurance that the future performance of any specific investment, investment strategy (including the investments and/or investment strategies recommended or undertaken by SBC Investment Management, LLC), or any non-investment related content, referred to directly or indirectly in this piece will be profitable, equal any corresponding indicated historical performance level(s), or prove successful. Due to various factors, including changing market conditions and/or applicable laws, the content may no longer be reflective of current opinions or positions. Moreover, you should not assume that any discussion or information contained in this piece serves as the receipt of, or as a substitute for, personalized investment advice from SBC Investment Management, LLC. Investment performance results published herein do not include investment advisory fees paid, or any other related account expenses. Performance results compiled solely by SBC Investment Management, LLC, have not been independently verified, and do not reflect the impact of taxes on non-qualified accounts.
Historical performance results for investment indices (provided for general comparison purposes only), strategies, models and/or indicators generally do not reflect the deduction of an investment management fee, nor the impact of taxes, the incurrence of which would have the effect of decreasing historical performance results. It should not be assumed that your account holdings correspond directly to any comparative indices.
Our past recommendations and model portfolio results are not a guarantee of future results. Using any graph, chart, formula, or other device to assist in deciding which securities to trade or when to trade them presents many difficulties and their effectiveness has significant limitations, including that prior patterns may not repeat themselves continuously or on any particular occasion. In addition, market participants using such devices can impact the market in a way that changes the effectiveness of such device.
SBC Investment Management, LLC is neither a law firm nor a certified public accounting firm. No portion of our website, our newsletter content, or any other correspondence from us should be construed as legal or accounting advice.