
The Rollercoaster Is Coming
In July 2024, the stock market experienced significant shifts, characterized by a notable rotation from large-cap technology stocks to small-cap stocks and value sectors. Here are the key highlights of the market performance during this month:
U.S. Stock Market Performance
S&P 500: The index posted a modest gain of 1.13% for July, bringing its year-to-date (YTD) return to 15.78%[1]. The performance was bolstered by a late-month rally due to expectations of potential interest rate cuts by the Federal Reserve[1].
Dow Jones Industrial Average: The Dow rose by 4.5% in July, marking its best performance of the year, and was up 8.37% YTD [1][2].
Nasdaq: The tech-heavy Nasdaq slipped by 0.7% in July, experiencing its worst July performance since 2014, as investors rotated out of mega-cap tech stocks[3][2].
Small-Cap Stocks: The Russell 2000 index surged by 10.2%, benefiting from investor enthusiasm for smaller companies amid expectations of interest rate cuts[4][2].
Sector Performance
Technology and Communication Services: These sectors were among the few that declined, with tech stocks falling by 3.3% and communication services by 4.2%[5][2].
Value Sectors: Real estate, financials, and utilities outperformed, with gains of 7.1%, 6.3%, and 5.9% respectively[5][2].
Economic Indicators and Federal Reserve Actions
Inflation and Interest Rates: Inflation showed signs of stabilizing, with the Consumer Price Index and Personal Consumption Expenditures Price Index indicating a downward trend. The Federal Reserve left interest rates unchanged but hinted at possible rate cuts in the coming months[3][2].
Economic Growth: The U.S. economy continued to grow at a modest pace, with GDP exceeding expectations in the second quarter. Consumer spending and private investments contributed positively to GDP growth[3].
Market Outlook
The market dynamics in July 2024 were driven by a combination of cooling inflation, expectations of Federal Reserve rate cuts, and a shift in investor sentiment towards small-cap and value stocks. This rotation away from large-cap tech stocks, which had led market gains earlier in the year, suggests a potential rebalancing as investors seek opportunities in undervalued sectors. The outlook remains cautiously optimistic, with the potential for continued gains if economic conditions support further rate cuts and stable growth[4][5].
In July 2024, the bond market experienced positive performance, driven largely by declining interest rates and expectations of future Federal Reserve rate cuts. Here are the key highlights:
Bond Market Performance
-U.S. Treasury Yields: Treasury yields fell across the curve, with the 10-year yield decreasing by 32 basis points and the 30-year yield falling by 20 basis points. This decline in yields led to an increase in bond prices, benefiting bondholders[6][7].
Bloomberg U.S. Aggregate Bond Index: This index posted a gain of 2.34% for July, marking a continuation of positive returns from the previous month. The decline in interest rates was a primary driver of this performance[8][7].
Long-Duration Bonds: Long-duration bonds outperformed shorter-duration bonds due to the larger impact of falling interest rates on longer-term securities[9][6].
-High Yield Bonds: High yield bonds also performed well, benefiting from strong corporate fundamentals and relatively stable credit spreads. However, there was caution regarding the potential for shifts to higher quality investment-grade bonds due to low credit spreads[9].
Market Influences
Federal Reserve Policy: The Federal Reserve maintained its interest rates in July but signaled potential rate cuts in the coming months. This expectation contributed to the decline in Treasury yields as investors anticipated a more accommodative monetary policy[6]10].
Inflation and Economic Data: Inflation continued to trend lower, moving closer to the Federal Reserve's 2% target. This disinflationary trend supported the bond market as it reduced pressure on yields[7].
Global Bond Markets: Non-U.S. bonds outperformed U.S. bonds year-to-date, as many foreign countries experienced faster declines in inflation, leading to quicker reductions in yields[9].
Overall, July 2024 was a favorable month for the bond market, with declining yields boosting bond prices and expectations of future rate cuts providing additional support. The bond market's performance was closely tied to macroeconomic indicators and central bank policies, which influenced investor sentiment and market dynamics.
Commentary:
July 2024 turned into a month of pivotal month for investors. Headline CPI year over year has been going down for several months what's the most recent data showing us now down below 4%. In some ways this is a little bit of a disillusion for the average consumer or Main Street. Because inflation is year over year, this just means that the rate of growth has decreased, not that the overall prices in the supermarket have decreased. It's just the increasing prices have decreased the rate of speed that they are increasing. So when I go to the grocery store and spend 30% more than I was a couple of years ago, Wall Street only cares about the rate of change number. Thus the rate of change is getting closer to the target rate, the street responds positively. This is reflective of what we saw across both the stock and bond markets.

When playing sports, there's an old saying that offense will put people in the seats but it is defense that wins the championships. From a behavioral finance perspective we see this in the fact that investors remember losses a lot longer than remember winners. Psychologists have talked about this for years in different studies in which the dopamine that comes from a positive experience tends to be less long lasting the chemicals and hormones that the body releases when they've had a very negative experience. Think about this in your own life, whether it comes to sports, relationships, or other activities the successes are oftentimes short lived while the failure seemed to be lingering. I know when i was playing competitive sports after we won a big game I would be on a high for a couple of days but when we lost a game I would be really upset for weeks at a time.
It is because of this psychology that we prefer to give them upside in the protection of the downside. This does not mean that we don't take any risk at all. Since January we have been going into the market and at this point in our portfolios we are nearly fully deployed in both the fixed income and equity. But we are still seeing problems in the credit market. Thus we have not moved any of our fixed income outside of short term treasuries because we do not feel the risk of a longer duration is worth the reinvestment risk that we face with short term treasuries. Will this cost us some upside? Who knows. But we'll have our downside protected.
We are seeing more and more volatility indicators coming up. The bond market has seemed to price in several rate cuts, but this is still early in the game. According to our friends at hedge I if there was going to be a rate cut it would be some time in the August to October window. Bond prices could pop relatively quickly as rates start to come down, but the 2yr / 10 yr treasury yield is still inverted.
Conclusion:
As we look ahead through the second-half of the summer months, we are always going to frame the next several possibilities in a positive, glass half full, framework. This does not mean we're going to take our eye off the risk ball, both that we're going to continue to adjust on the fringes to ensure that we have the optimal balance between discovery reward, favoring protection of the downside. As mentioned above there is a rotation from large growth (tech stocks) to small value stocks. When this type of rotation happens a few things could be in play. There could be people taking profits off the table and looking for some areas of the market that had been underperforming or investors are starting to realize what many people have been the same for a long time, the S&P 500 is a market weighted index in which five to seven companies account for the majority of the growth of the index. We have some volatile times ahead of us thus having the right balance of stocks, fixed income, alternatives, and cash is critical to protect the downside. As the cartoon below illustrates below, this are going to get rocky.

Model Performance Update
Our Moderate model portfolio returned -0.31% during the Month of June and finished the month with 5.49% Year to Date (see chart below).
Changes to the model portfolio in June
- Sold URA and URNM
June 2024 performance with benchmark
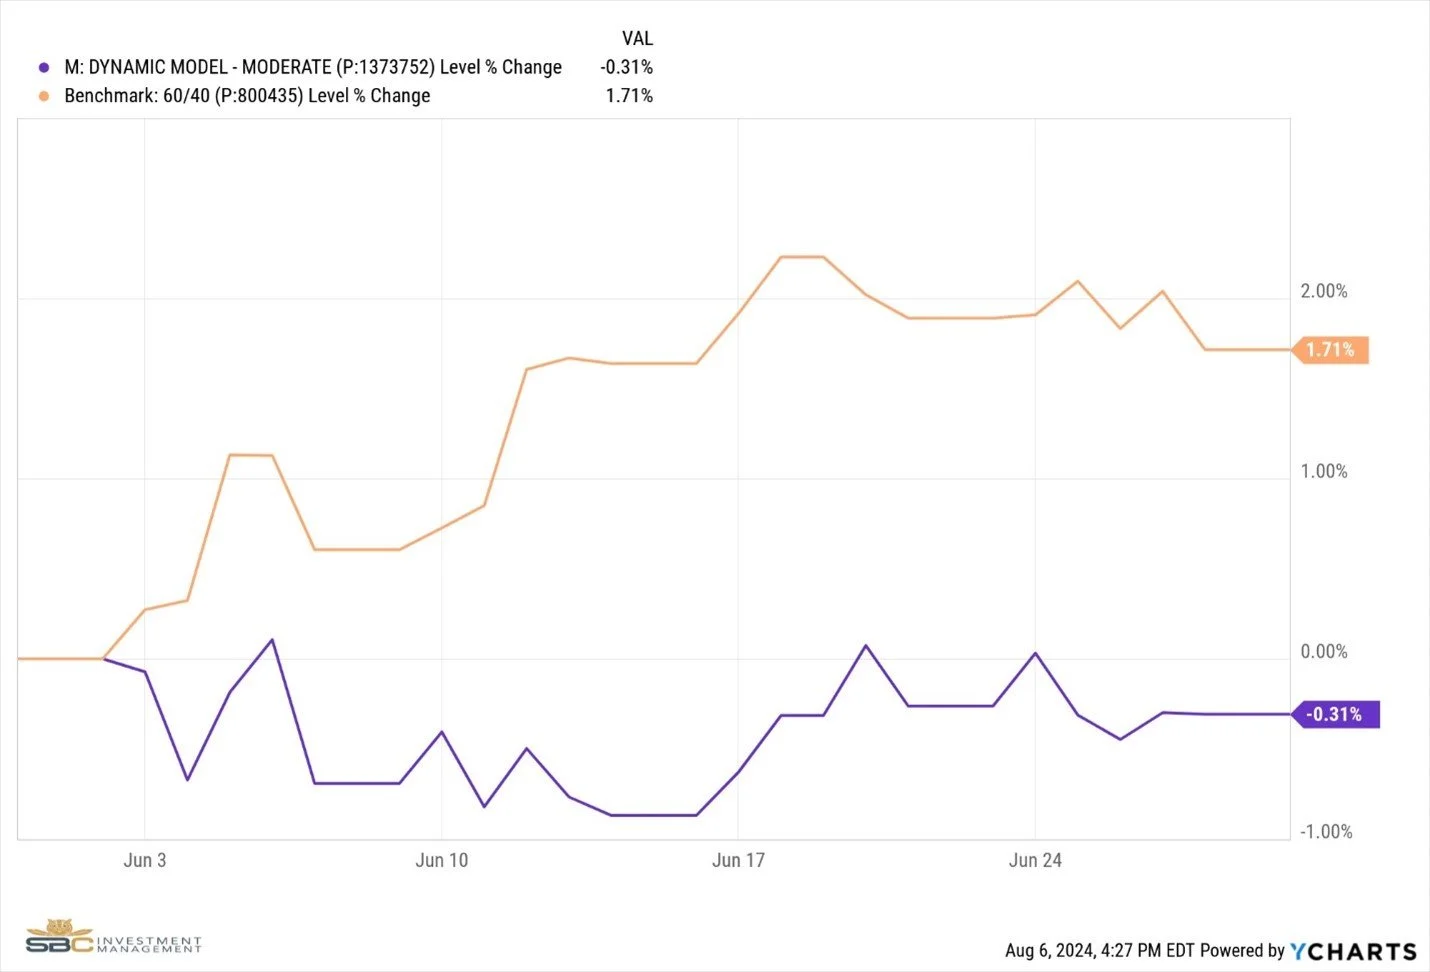
June YTD Performance with Benchmark

If you were to have any questions regarding the above, please reach out to us to set up a one-to-one meeting to review your situation.
Sincerely,
Bryant Andrus, MSF, CFP®
President
SBC Investment Management
P: (602) 641-5996
M: (319) 520-2033
E: bandrus@sbcinvestmentmanagement.com
DISCLAIMERS
SBC Investment Management’s Monthly and Quarterly Market Summary and Outlook is intended to communicate current economic and capital market information along with the informed perspectives of our investment professionals. All expressions of opinion are subject to change. Past performance may not be indicative of future results. There is no assurance that any of the trends discussed will continue, or that any of the forecasts will occur.
You should not construe any information in this publication as investment, financial, or any other professional advice. Nothing contained in this publication constitutes a recommendation, endorsement, or an offer to buy or sell any securities or other financial instruments. You should conduct your own research or speak to your investment advisor before investing.
SBC Investment Management prepares this material as a resource for its clients. This content is for informational purposes only and does not address the circumstances of any particular individual or entity. You may contact us to discuss the content of this publication within the context of your own financial situation.
Past performance may not be indicative of future results. Different types of investments involve varying degrees of risk. There can be no assurance that the future performance of any specific investment, investment strategy (including the investments and/or investment strategies recommended or undertaken by SBC Investment Management, LLC), or any non-investment related content, referred to directly or indirectly in this piece will be profitable, equal any corresponding indicated historical performance level(s), or prove successful. Due to various factors, including changing market conditions and/or applicable laws, the content may no longer be reflective of current opinions or positions. Moreover, you should not assume that any discussion or information contained in this piece serves as the receipt of, or as a substitute for, personalized investment advice from SBC Investment Management, LLC. Investment performance results published herein do not include investment advisory fees paid, or any other related account expenses. Performance results compiled solely by SBC Investment Management, LLC, have not been independently verified, and do not reflect the impact of taxes on non-qualified accounts.
Historical performance results for investment indices (provided for general comparison purposes only), strategies, models and/or indicators generally do not reflect the deduction of an investment management fee, nor the impact of taxes, the incurrence of which would have the effect of decreasing historical performance results. It should not be assumed that your account holdings correspond directly to any comparative indices.
Our past recommendations and model portfolio results are not a guarantee of future results. Using any graph, chart, formula, or other device to assist in deciding which securities to trade or when to trade them presents many difficulties and their effectiveness has significant limitations, including that prior patterns may not repeat themselves continuously or on any particular occasion. In addition, market participants using such devices can impact the market in a way that changes the effectiveness of such device.
Hypothetical performance results shown in this report and on sbcinvestmentmanagement.com are backtested and do not represent the performance of any account managed by SBC Investment Management, LLC. They were achieved by means of the retroactive application of each of the previously referenced models, certain aspects of which may have been designed with the benefit of hindsight.
The hypothetical backtested performance does not represent the results of actual trading using client assets nor decision-making during the period and does not and is not intended to indicate the past performance or future performance of any account or investment strategy managed by SBC Investment Management, LLC. If actual accounts had been managed throughout the period, ongoing research might have resulted in changes to the strategy, which might have altered returns. The performance of any account or investment strategy managed by SBC Investment Management, LLC will differ from the hypothetical backtested performance results for each factor shown herein for a number of reasons, including without limitation the following:
Although SBC Investment Management, LLC may consider from time to time one or more of the factors noted herein in managing any account, it may not consider all or any of such factors. SBC Investment Management, LLC may (and will) from time to time consider factors in addition to those noted herein in managing any account.
SBC Investment Management, LLC may rebalance an account more frequently or less frequently than annually and at times other than presented herein.
The hypothetical backtested performance results for each strategy include estimated values for transaction costs of buying and selling securities, which may not be accurate. Investment management fees, custody and other costs, and taxes – all of which would be incurred by an investor in any account managed by SBC Investment Management, LLC are not included in performance results. If such costs and fees were reflected, the hypothetical backtested performance results would be lower.
The hypothetical performance does not reflect the reinvestment of dividends and distributions therefrom, interest, capital gains and withholding taxes.
Accounts managed by SBC Investment Management, LLC are subject to additions and redemptions of assets under management, which may positively or negatively affect performance depending generally upon the timing of such events in relation to the market’s direction.
Simulated returns may be dependent on the market and economic conditions that existed during the period. Future market or economic conditions can adversely affect the returns.
SBC Investment Management, LLC is neither a law firm nor a certified public accounting firm. No portion of our website, our newsletter content, or any other correspondence from us should be construed as legal or accounting advice.
[1]https://www.rothschildandco.com/en/newsroom/insights/2024/07/wealth-management-monthly-market-summary-june-2024/
https://www.cnbc.com/2024/06/27/stock-market-today-live-updates.html
https://www.cashdollarandassociates.com/p/june-market-report
https://rgwealth.com/market-thoughts/market-recap-june-2024/
[2] https://www.lpl.com/research/blog/weekly-market-performance-june-28-2024.html
https://www.schwab.com/learn/story/corporate-bond-outlook
https://www.morningstar.com/funds/how-largest-bond-funds-did-q2-2024
https://www.cnbc.com/2024/07/03/us-treasurys-ahead-of-key-economic-data-fed-meeting-minutes-.html