
Is All Well in The World?
Headlines over the past month:
In February 2024, global stock markets experienced a remarkable surge, with major indices reaching new all-time highs[1][2]. Here's a summary of the key developments:
Strong Performance
The S&P 500 rose by 5.2%, marking its best February since 2015 [2].
The Nasdaq climbed 6.1%, also achieving its strongest February performance since 2015 [2].
Global equities overall surged by 4.3% in USD terms [1].
Record-Breaking Highs
Several major stock indices reached record levels, including the S&P 500, Euro Stoxx 600, and Nikkei 225 [1].
The Dow Jones Industrial Average gained 2.1%, its best February since 2021 [2].
Key Drivers
Tech stocks played a significant role, with companies like Nvidia (up 30%), Meta (up 26%), and Amazon (up 13%) adding nearly $1 trillion in market capitalization during February alone [2].
The "Magnificent Seven" tech stocks showed mixed performance, with Nvidia surging 60% in 2024 while Tesla declined by a fifth [1].
71% of S&P 500 stocks reported positive returns for the month [2].
Economic Context
The strong performance came despite rising bond yields, with US 10-year government bond yields increasing to 4.3% [1].
Investor optimism regarding significant earnings growth outweighed concerns about historically high interest rates [2].
The Q4 earnings growth rate for S&P 500 companies was 4%, bringing the annual figure to 0.9% [1].
Global Perspective
Regional returns broadened, with growth stocks leading the market higher [1].
Japan's stock market rose 3.0%, while Emerging Market Asia saw a 5.9% increase [1].
European markets also performed well, with the Eurozone up 2.9% [1].
Other Notable Developments
Bitcoin surged close to record highs, surpassing $60,000 [1].
The strong February performance is particularly noteworthy given the month's historical reputation for below-trend returns [2].
This robust February performance, building on January's gains, gave the S&P 500 its strongest start to a year since 2019 [2]. The market's strength has already surpassed many analysts' end-of-2024 forecasts, prompting some firms to revise their targets upward [2].
Bond Market
In February 2024, the bond market experienced significant movements, characterized by rising yields and falling prices across various segments. Here are the key highlights:
U.S. Treasury Market
Yields Increase: The yield on the 10-year U.S. Treasury bond rose to 4.25%, up from 3.99% at the end of January, driven by strong economic data and persistent inflation[3] [4].
Sell-Off: There was a notable sell-off in U.S. government bonds as expectations for immediate Federal Reserve rate cuts diminished. The robust economy and strong job growth contributed to this trend [4].
Corporate Bonds
Performance: The Bloomberg U.S. Corporate Investment Grade (IG) Index declined by 1.50%, with negative excess returns of 0.11%. Shorter maturities outperformed longer ones, and BBB-rated bonds had the highest relative returns, while AAA-rated bonds performed the worst[5].
Issuance and Inflows: IG corporate bond issuance was $190 billion, with net issuance at $134 billion after redemptions. IG bond funds saw inflows of about $18 billion [5].
Municipal Bonds
Yields and Performance: Municipal bond yields increased modestly, with the Bloomberg Municipal Bond Index gaining 0.13%. Shorter maturities had the best relative returns, and lower quality outperformed higher quality [5].
Issuance: Municipal bond issuance was nearly $27.6 billion, 11% lower than January but 25% higher than February 2023. Taxable municipal bond issuance increased by 9% compared to the previous year [5].
Aggregate Bond Market
Overall Decline: The Bloomberg U.S. Aggregate Bond Index fell by approximately 1.4% in February, marking its worst monthly performance since September 20233 [6].
High Yield Bonds: The Bloomberg High Yield Index managed a slight gain of 0.29% for the month [3].
Global Perspective
Global Bond Yields: Government bond yields rose globally, reflecting the anticipation of future interest rate cuts, although not immediately. This led to falling bond prices worldwide[7].
Economic Context
Inflation and Fed Policy: The Federal Reserve's cautious stance on rate cuts, influenced by ongoing inflation concerns, contributed to rising yields and increased market volatility. The market adjusted expectations for rate cuts to start in June rather than March [4].
Overall, February 2024 was a challenging month for bond investors, with rising yields and falling prices across most segments. The strong economic data and persistent inflation led to a reassessment of interest rate expectations, impacting bond market performance.
Commentary:
February 2024 was a month in which the general economy seems to be getting better. Real earnings of the households in the United States have been negative for some time due to inflation. The trend has seemed to reverse. Difficulty in paying one's bills also have decreased for the average household across the board. These are both very good trends.


The US is a consumer driven economy thus when the general household has more money to spend it will boost the economy overall. However as we discussed in previous newsletters there is still are student loan payment issues, increasing credit card debt, and inflation continues to rise. There are lots of headwinds, by cultivating an improvement in consumer sentiment is less bad and thus help move the sentiment from an investment manager standpoint to be willing to move into more risk (put more cash into the market)
Is everything good across the board, no. Two of the magnificent 7 stocks have started to pull back, Apple and Tesla. The S&P 500 continues to breach all time highs, which means it might be due for a pullback or a correction. And there's still that inverted yield curve with the 10 year and 2 year bond (see below), which has been an indicator of in remaining recession which would in turn cause a correction or pullback in the market.

Conclusion:
My oldest son when he was living at home like to find ways to get out of doing chores like every other teenager. When we would catch him in a weak excuse about why he did not do a chore he would oftentimes try to bolster his argument and dig himself a little deeper. We eventually got to the point that we we'll look at him and say “if you want to get out of the hole you are in you first have to put down the shovel and stop digging.”
The US, as well as other countries, are in many ways like my oldest… you first have to stop spending more than you bring in to get out of debt. While at times you can grow your way out of debt by growing the economy and bringing in more tax dollars, if the spending grows at a rate faster than the growth rate of your tax collections we have a problem. Keith McCullough said earlier in February.
“When your debt-to-GDP ratio gets worse, you can’t borrow your way out of a debt crisis. It doesn’t mean the world comes to an end or we default the next day. You get slower and slower growth, which is consistent with the depression thesis, punctuated with recessions.”
We could not agree more… you have to put down the shovel before you can climb out.

While we remain cautiously optimistic about what the future holds with respect to the overall world economy specifically with the US at the center, we continue to exercise caution as we start to deploy cash back into risk assets, mainly on the Equity side of the market.
We're purposely moving very slowly during this period of time as the treasury yields are still over 5% which are as nearly risk free as possible combined with our mandate to protect the downside, we constantly are looking mindful of the risked involved with investing. Headwinds are here to stay.
Model Performance Update
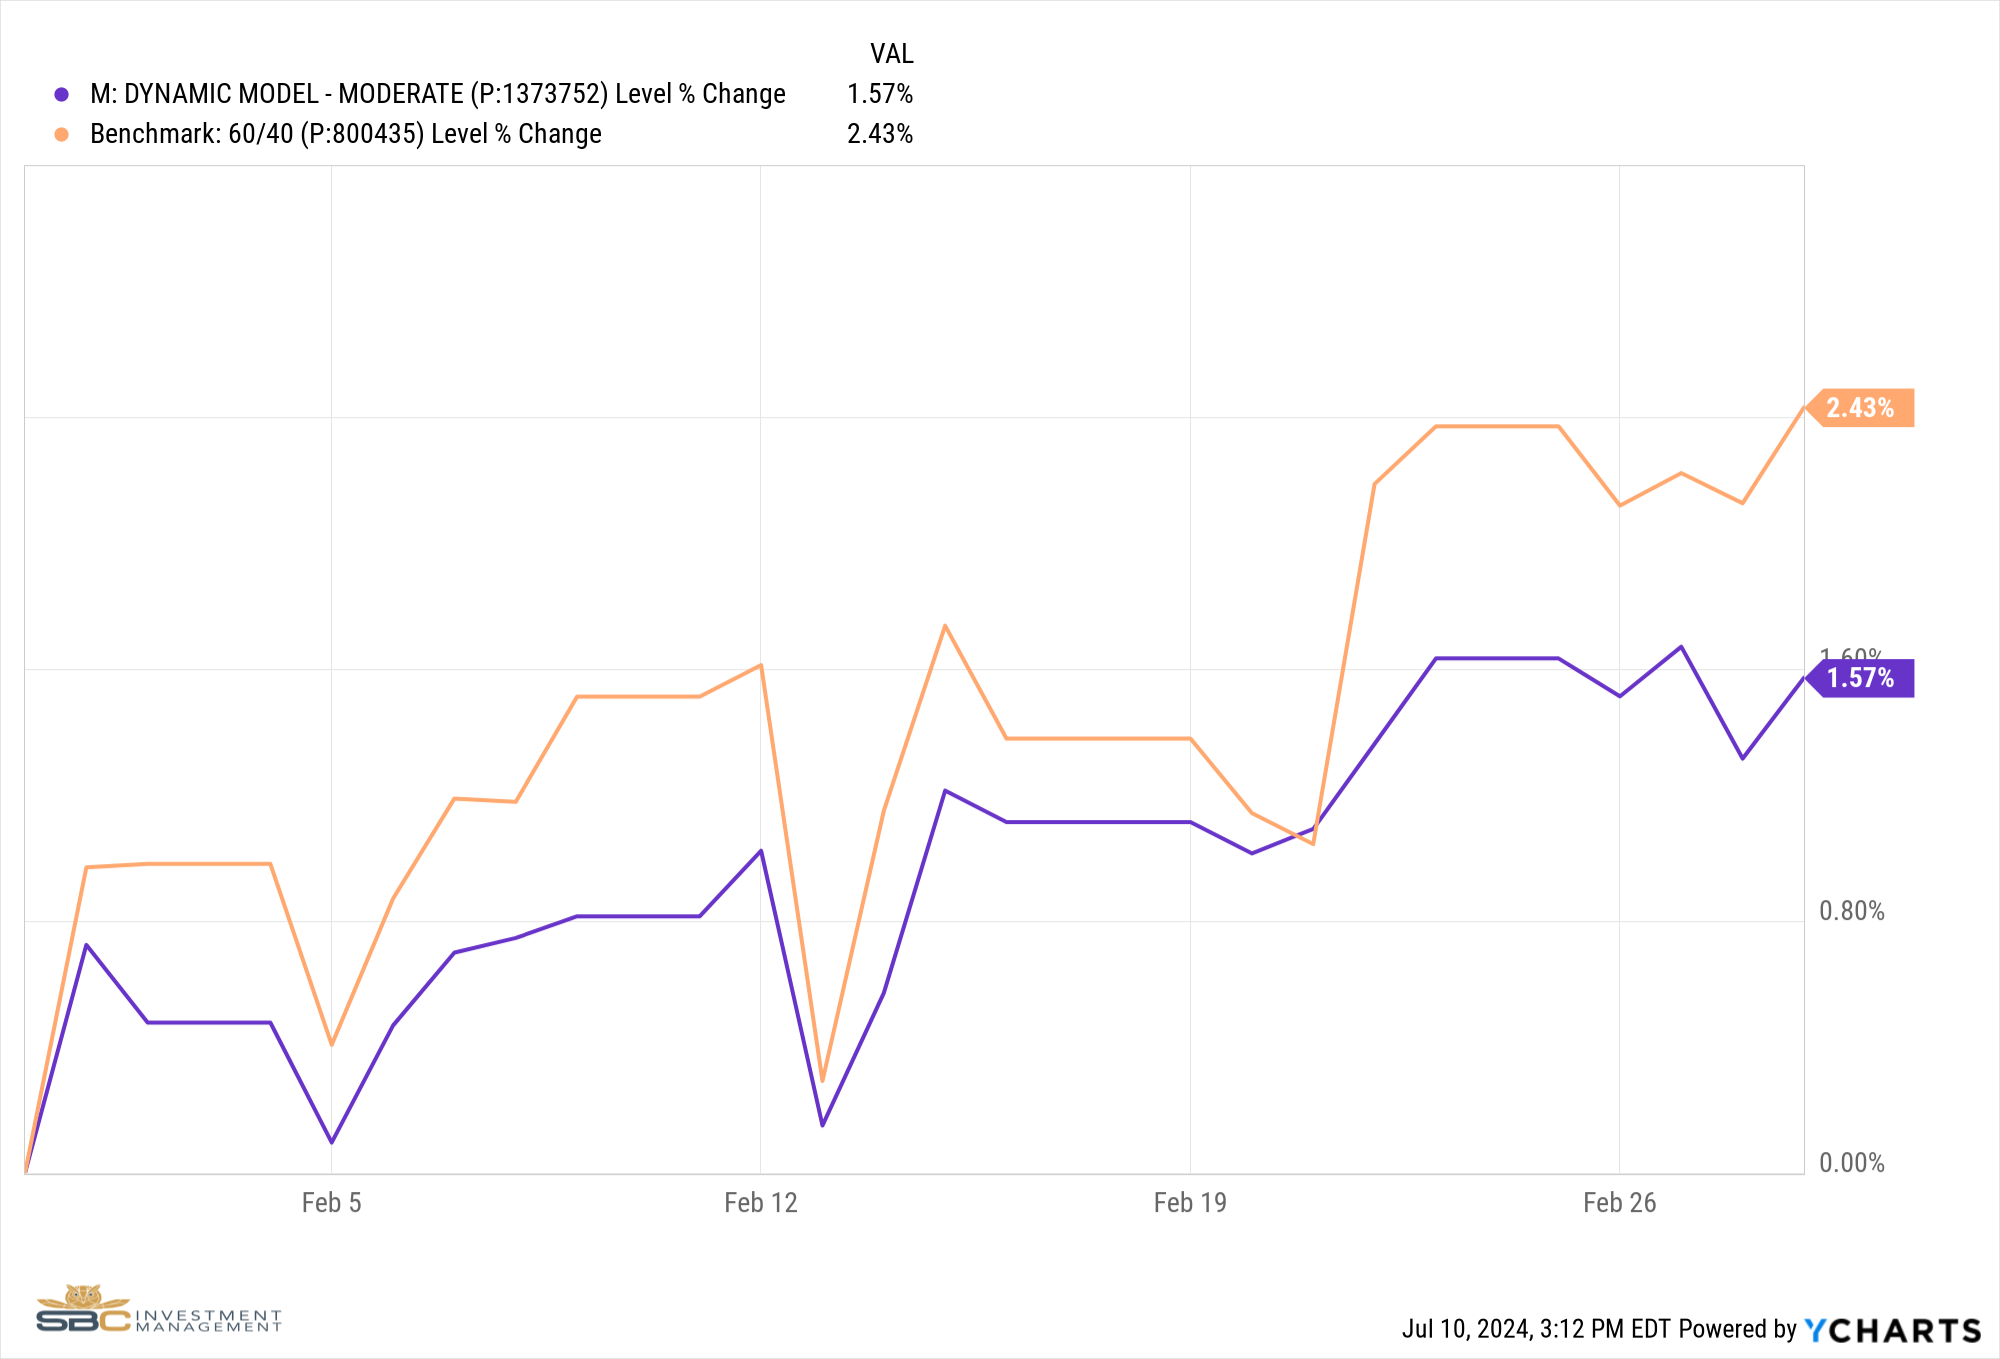
Our Moderate model portfolio returned 1.57% during the Month of February and finished the month with a 2.02% return Year to Date (see chart below).
Changes to the model portfolio in February
- No significant changes
February 2024 performance with benchmark
February YTD performance with benchmark

If you were to have any questions regarding the above, please reach out to us to set up a one-to-one meeting to review your situation.
Sincerely,
Bryant Andrus, MSF, CFP®
President
SBC Investment Management
P: (602) 641-5996
M: (319) 520-2033
E: bandrus@sbcinvestmentmanagement.com
DISCLAIMERS
SBC Investment Management’s Monthly and Quarterly Market Summary and Outlook is intended to communicate current economic and capital market information along with the informed perspectives of our investment professionals. All expressions of opinion are subject to change. Past performance may not be indicative of future results. There is no assurance that any of the trends discussed will continue, or that any of the forecasts will occur.
You should not construe any information in this publication as investment, financial, or any other professional advice. Nothing contained in this publication constitutes a recommendation, endorsement, or an offer to buy or sell any securities or other financial instruments. You should conduct your own research or speak to your investment advisor before investing.
SBC Investment Management prepares this material as a resource for its clients. This content is for informational purposes only and does not address the circumstances of any particular individual or entity. You may contact us to discuss the content of this publication within the context of your own financial situation.
Past performance may not be indicative of future results. Different types of investments involve varying degrees of risk. There can be no assurance that the future performance of any specific investment, investment strategy (including the investments and/or investment strategies recommended or undertaken by SBC Investment Management, LLC), or any non-investment related content, referred to directly or indirectly in this piece will be profitable, equal any corresponding indicated historical performance level(s), or prove successful. Due to various factors, including changing market conditions and/or applicable laws, the content may no longer be reflective of current opinions or positions. Moreover, you should not assume that any discussion or information contained in this piece serves as the receipt of, or as a substitute for, personalized investment advice from SBC Investment Management, LLC. Investment performance results published herein do not include investment advisory fees paid, or any other related account expenses. Performance results compiled solely by SBC Investment Management, LLC, have not been independently verified, and do not reflect the impact of taxes on non-qualified accounts.
Historical performance results for investment indices (provided for general comparison purposes only), strategies, models and/or indicators generally do not reflect the deduction of an investment management fee, nor the impact of taxes, the incurrence of which would have the effect of decreasing historical performance results. It should not be assumed that your account holdings correspond directly to any comparative indices.
Our past recommendations and model portfolio results are not a guarantee of future results. Using any graph, chart, formula, or other device to assist in deciding which securities to trade or when to trade them presents many difficulties and their effectiveness has significant limitations, including that prior patterns may not repeat themselves continuously or on any particular occasion. In addition, market participants using such devices can impact the market in a way that changes the effectiveness of such device.
Hypothetical performance results shown in this report and on sbcinvestmentmanagement.com are backtested and do not represent the performance of any account managed by SBC Investment Management, LLC. They were achieved by means of the retroactive application of each of the previously referenced models, certain aspects of which may have been designed with the benefit of hindsight.
The hypothetical backtested performance does not represent the results of actual trading using client assets nor decision-making during the period and does not and is not intended to indicate the past performance or future performance of any account or investment strategy managed by SBC Investment Management, LLC. If actual accounts had been managed throughout the period, ongoing research might have resulted in changes to the strategy, which might have altered returns. The performance of any account or investment strategy managed by SBC Investment Management, LLC will differ from the hypothetical backtested performance results for each factor shown herein for a number of reasons, including without limitation the following:
Although SBC Investment Management, LLC may consider from time to time one or more of the factors noted herein in managing any account, it may not consider all or any of such factors. SBC Investment Management, LLC may (and will) from time to time consider factors in addition to those noted herein in managing any account.
SBC Investment Management, LLC may rebalance an account more frequently or less frequently than annually and at times other than presented herein.
The hypothetical backtested performance results for each strategy include estimated values for transaction costs of buying and selling securities, which may not be accurate. Investment management fees, custody and other costs, and taxes – all of which would be incurred by an investor in any account managed by SBC Investment Management, LLC are not included in performance results. If such costs and fees were reflected, the hypothetical backtested performance results would be lower.
The hypothetical performance does not reflect the reinvestment of dividends and distributions therefrom, interest, capital gains and withholding taxes.
Accounts managed by SBC Investment Management, LLC are subject to additions and redemptions of assets under management, which may positively or negatively affect performance depending generally upon the timing of such events in relation to the market’s direction.
Simulated returns may be dependent on the market and economic conditions that existed during the period. Future market or economic conditions can adversely affect the returns.
SBC Investment Management, LLC is neither a law firm nor a certified public accounting firm. No portion of our website, our newsletter content, or any other correspondence from us should be construed as legal or accounting advice.
[1] https://www.rothschildandco.com/en/newsroom/insights/2024/03/wealth-management-monthly-market-summary-february-2024/
[2] https://www.forbes.com/sites/dereksaul/2024/02/29/sp-500-notches-best-february-in-9-years/
[3] https://www.usicg.com/publications/market--legal-update/mlu-container-page/mlu-02-2024
[4] https://www.reuters.com/markets/rates-bonds/slam-dunk-treasury-trade-becomes-test-patience-yields-march-higher-2024-02-26/
[5]https://www.breckinridge.com/insights/details/february-2024-market-commentary/
[6] https://www.mandg.com/investments/professional-investor/en-ch/insights/mandg-insights/latest-insights/2024/03/fixed-income-our-monthly-review-february-2024
[7] https://www.schroders.com/en/global/individual/insights/monthly-markets-review---february-2024/