
Watching Paint Dry
Summary of Stock Market Performance in January 2024
The stock market in January 2024 experienced overall positive performance, with notable variations across different indices and sectors. Here are the key highlights:
Major Indices Performance
S&P 500: The S&P 500 index rose by approximately 1.7% during January 2024, indicating a solid start to the year for large-cap stocks[1] [2].
Dow Jones Industrial Average (DJIA): The DJIA increased by 1.3%, reflecting gains in blue-chip stocks [1][3].
NASDAQ: The NASDAQ Composite added 1.0%, driven by the performance of technology and growth stocks [1] [3].
Russell 2000: The Russell 2000, which tracks small-cap stocks, underperformed with a decline of 3.9%[3] [1].
Sector Performance
Top Performers: Communication Services and Financials were the leading sectors, with Communication Services gaining 4.4% and Financials up by 3.1% [1].
Laggards: The Materials, Consumer Discretionary, and Real Estate sectors faced declines, with Real Estate falling by 4.8% [1].
Notable Stock Movements
Tesla, Inc.: Tesla's stock experienced a significant drop, falling by 22.88% over the month.
Nvidia Corp: Nvidia saw a substantial increase, with its stock rising by 30.32%.
Microsoft Corp: Microsoft also performed well, with a gain of 10.17%.
Apple Inc: Apple had a modest increase of 1.29%.
Economic and Market Context
Inflation and Federal Reserve: Inflation data showed a slight increase in December, and the Federal Reserve maintained the federal funds target rate at 5.25%-5.50%, citing ongoing economic strength and steady job gains [3] [2].
Economic Growth: The U.S. economy demonstrated resilience, with a fourth-quarter GDP growth rate of 3.3% and consumer spending contributing significantly [3] [2].
Employment: The labor market remained robust, with 353,000 new jobs added in January, surpassing expectations [1].
Global Market Performance
Global Equities: Global equities rose by 0.6% in USD terms, with the U.S. market outperforming other regions. The Eurozone and Japan also saw gains, while the UK and Emerging Markets faced declines[4].
Commodities: Brent Crude oil prices increased by 6% to $82 per barrel, while gold prices fell by 1% but remained above $2,000 [4].
Overall, January 2024 was characterized by a positive start for major U.S. stock indices, driven by gains in specific sectors and notable performances by individual stocks like Nvidia and Microsoft. However, small-cap stocks and certain sectors like Real Estate faced challenges. The economic backdrop remained strong, with steady job growth and resilient consumer spending, despite ongoing inflation concerns and geopolitical tensions.
Summary of the Bond Market in January 2024
The bond market experienced a mixed performance in January 2024, following a strong rally at the end of 2023. Key highlights include:
Yield movements: The 10-year Treasury yield rose to around 4% for most of the month, up from 3.86% at the end of 2023[5] [6]. Yields increased early in the month as rate cut expectations were pushed back but bounced back towards the end of January[7].
Government and inflation-linked bonds: These securities performed poorly early in the month due to delayed rate cut expectations but recovered later [7].
Corporate bonds: Performance was mixed across different segments. USD-denominated high yield spreads widened by 20 basis points, while EUR-denominated high yield spreads tightened by 12 basis points. Euro corporate hybrids were the best performers, with spreads tightening by 28 basis points [7].
Record issuance: January 2024 saw record bond issuance, particularly in Europe. The primary market in Europe topped €300 billion, surpassing the previous year's total. Despite the high supply, demand remained strong, with bids for new issues in Europe exceeding €1 trillion [7].
Economic context: The U.S. economy demonstrated resilience, with fourth-quarter GDP growth at 3.3% and strong job gains. Inflation data showed a slight increase, keeping the Federal Reserve cautious about potential rate cuts [7] [6].
Federal Reserve stance: The Fed maintained the federal funds target rate at 5.25%-5.50% during its January meeting, citing ongoing economic strength and steady job gains [7].
Market expectations: Investors began adjusting their expectations for interest rate cuts, with the probability of a March rate cut decreasing to around 49% [6].
Fixed income ETF flows: January saw strong inflows into fixed income ETFs, with $8.3 billion in net new assets, particularly in EUR investment grade credit and high yield bonds [7].
Overall, the bond market in January 2024 was characterized by rising yields, record issuance met with strong demand, and a reassessment of rate cut expectations amid a resilient economic backdrop.
Commentary:
Coming out of 2023, there's a lot of uncertainty about what would make up 2024. We have had leading indicators accelerating in the wrong direction for nearly two years now, yet the stock market continues to rise. Government spending is influencing markets, job reports, interest rates, inflation, and other areas which is something no one expected. Better said, government continues to spend like a drunken sailor without focus on the long-term effects. On top of this, we are now heading into an election year. As I have previously discussed, the divergence between economic data and the broad stock and bond market is not something new. However, a stock is an ownership in a company that produces a good or service. When the economy can no longer buy that good or service, it will eventually affect the price or the value of that company. When the perceived value of the company goes up or down, so does the price of the stock. Very straightforward.
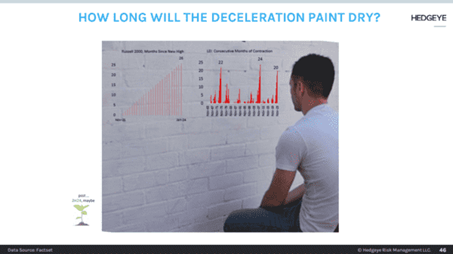
So where does that leave us in the cycle? We've had 26 months of deceleration of earnings. The Russell 2000 year over year net income has been atrocious. While the S&P 500 has stayed positive, it is negative if we strip out the top five largest companies, and it gets worse if we look at leaving out the top five companies and manufacturing. So, as we pull back on this facade that has been produced in 2023 and partly in the first month of 2024 how do we position ourselves and where do we go from here?
From our friends at Hedgeye Risk Management:

Government spending in 2023 accounted for close to 30% of the growth of the GDP and accounted for 17% of the total spending. This trend is not sustainable. Where we go from here?
Conclusion:
Warren Buffett famously said, “When there is blood in the streets, start to buy” or something to that effect. With the election year upon us, higher inflation, higher interest rates, and other headwinds may create a good time to start to lean back into markets. The exact timing of when to start buying, when there's enough blood in the streets, it will be part of the art of what happens over the next three to five months. If we look at the positioning through the lens of the Quads that Hedgeye has created (see next page), we are looking for a rough couple of months followed by a good summer and fluid second ½ of the year.
We saw some unusual down periods in the first few days of 2024, especially among the magnificent 7 stocks, followed by some flattening and overall slight positive trend upwards in the last half of the month, while the bond side continued to decline. Markets are continuing to price in several rate cuts based on the expectations except by the Federal Reserve throughout the year, but I don't foresee this happening due to inflation remaining higher than what their target is. Inflation has been coming down but is still well above their target rate.
We expect to reallocate cash into our respective satellites over the course of the next two months. As we reposition the portfolio, there are many factors as to why we are repositioning and circling back out of cash. During profit recessions like what we are seeing in the Russel 2000 and most of the S&P 500, the industry itself will start to self-correct and create buying opportunities. Election years are oftentimes when the incumbent is spending a lot of money to try to keep himself into office. During 2023, we saw the government spending increase at levels never seen before. Some may say that they were trying to prop up the stock market, while keeping the everyday person blissfully unaware of the underlying economy. I believe most people saw through that, but many people did not. Government spending accounted for 17% of GDP and 30% of GDP growth in 2023. If the government is willing to spend that much in a non-election year, what will be we willing to spend during an election year? Thus, we are not fighting against any one side or the other, we are positioning the portfolios with the risk conscious investment for philosophy focusing on client’s needs.

Model Performance Update
Our Moderate model portfolio returned .44% during the Month of January and finished the month with .44% Year to Date (see chart below).
Hedgeye is still reiterating its call for a U.S. recession and credit event, given no change in the downtrend in U.S. economic data. They expect the first half of 2024 to be in Quad4, where both growth and inflation slow, as the economy moves through the worst part of the downturn then bottoms. Their signals have been flip-flopping back and forth, we will continue to hold our positions until we have a clear direction.
Hedgeye had its 2024 Quarter 1 Macro Themes Call.
Changes to the model portfolio in January
- No significant changes from last months adjustments.
January 2024 performance with benchmark

If you were to have any questions regarding the above, please reach out to us to set up a one-to-one meeting to review your situation.
Sincerely,
Bryant Andrus, MSF, CFP®
President
SBC Investment Management
P: (602) 641-5996
M: (319) 520-2033
E: bandrus@sbcinvestmentmanagement.com
DISCLAIMERS
SBC Investment Management’s Monthly and Quarterly Market Summary and Outlook is intended to communicate current economic and capital market information along with the informed perspectives of our investment professionals. All expressions of opinion are subject to change. Past performance may not be indicative of future results. There is no assurance that any of the trends discussed will continue, or that any of the forecasts will occur.
You should not construe any information in this publication as investment, financial, or any other professional advice. Nothing contained in this publication constitutes a recommendation, endorsement, or an offer to buy or sell any securities or other financial instruments. You should conduct your own research or speak to your investment advisor before investing.
SBC Investment Management prepares this material as a resource for its clients. This content is for informational purposes only and does not address the circumstances of any particular individual or entity. You may contact us to discuss the content of this publication within the context of your own financial situation.
Past performance may not be indicative of future results. Different types of investments involve varying degrees of risk. There can be no assurance that the future performance of any specific investment, investment strategy (including the investments and/or investment strategies recommended or undertaken by SBC Investment Management, LLC), or any non-investment related content, referred to directly or indirectly in this piece will be profitable, equal any corresponding indicated historical performance level(s), or prove successful. Due to various factors, including changing market conditions and/or applicable laws, the content may no longer be reflective of current opinions or positions. Moreover, you should not assume that any discussion or information contained in this piece serves as the receipt of, or as a substitute for, personalized investment advice from SBC Investment Management, LLC. Investment performance results published herein do not include investment advisory fees paid, or any other related account expenses. Performance results compiled solely by SBC Investment Management, LLC, have not been independently verified, and do not reflect the impact of taxes on non-qualified accounts.
Historical performance results for investment indices (provided for general comparison purposes only), strategies, models and/or indicators generally do not reflect the deduction of an investment management fee, nor the impact of taxes, the incurrence of which would have the effect of decreasing historical performance results. It should not be assumed that your account holdings correspond directly to any comparative indices.
Our past recommendations and model portfolio results are not a guarantee of future results. Using any graph, chart, formula, or other device to assist in deciding which securities to trade or when to trade them presents many difficulties and their effectiveness has significant limitations, including that prior patterns may not repeat themselves continuously or on any particular occasion. In addition, market participants using such devices can impact the market in a way that changes the effectiveness of such device.
Hypothetical performance results shown in this report and on sbcinvestmentmanagement.com are backtested and do not represent the performance of any account managed by SBC Investment Management, LLC. They were achieved by means of the retroactive application of each of the previously referenced models, certain aspects of which may have been designed with the benefit of hindsight.
The hypothetical backtested performance does not represent the results of actual trading using client assets nor decision-making during the period and does not and is not intended to indicate the past performance or future performance of any account or investment strategy managed by SBC Investment Management, LLC. If actual accounts had been managed throughout the period, ongoing research might have resulted in changes to the strategy, which might have altered returns. The performance of any account or investment strategy managed by SBC Investment Management, LLC will differ from the hypothetical backtested performance results for each factor shown herein for a number of reasons, including without limitation the following:
Although SBC Investment Management, LLC may consider from time to time one or more of the factors noted herein in managing any account, it may not consider all or any of such factors. SBC Investment Management, LLC may (and will) from time to time consider factors in addition to those noted herein in managing any account.
SBC Investment Management, LLC may rebalance an account more frequently or less frequently than annually and at times other than presented herein.
The hypothetical backtested performance results for each strategy include estimated values for transaction costs of buying and selling securities, which may not be accurate. Investment management fees, custody and other costs, and taxes – all of which would be incurred by an investor in any account managed by SBC Investment Management, LLC are not included in performance results. If such costs and fees were reflected, the hypothetical backtested performance results would be lower.
The hypothetical performance does not reflect the reinvestment of dividends and distributions therefrom, interest, capital gains and withholding taxes.
Accounts managed by SBC Investment Management, LLC are subject to additions and redemptions of assets under management, which may positively or negatively affect performance depending generally upon the timing of such events in relation to the market’s direction.
Simulated returns may be dependent on the market and economic conditions that existed during the period. Future market or economic conditions can adversely affect the returns.
SBC Investment Management, LLC is neither a law firm nor a certified public accounting firm. No portion of our website, our newsletter content, or any other correspondence from us should be construed as legal or accounting advice.
[1] https://pittand.com/2024/02/15/january-2024-market-recap/
[2] https://www.mmbb.org/personal-finance/monthly-market-summary-january-2024
[3] https://www.redwoodcu.org/about/blog/january-market-recap-2024/
[4] https://www.rothschildandco.com/en/newsroom/insights/2024/02/wealth-management-monthly-market-summary-january-2024/
[5] https://www.wsj.com/livecoverage/stock-market-today-dow-jones-01-03-2024/card/bond-yields-reach-4--GWADcwc2JZL2pKUF3T2Z
[6] https://www.cnbc.com/2024/01/24/treasury-yields-pull-back-as-big-economic-data-releases-come-into-view.html
[7] https://www.invesco.com/apac/en/institutional/insights/fixed-income/invesco-monthly-fixed-income-update-february-2024.html