
Earnings Lift All Boats in August
Commentary:
August marked the fourth straight monthly advance for U.S. equities as a powerful earnings pulse broadened the rally beyond mega cap technology. All major indices finished higher, while a softer inflation print kept September rate cut odds elevated.
U.S. large-cap stocks continued their advance, but leadership finally broadened. The S&P 500 gained roughly 2% in August, its fourth consecutive monthly rise. More striking was the resurgence in small caps: the Russell 2000 soared 7%, its best month since late 2023 and more than triple the S&P’s return. Overseas, developed-market equities also participated; the MSCI EAFE Index posted a 4.26% total-return gain in U.S. dollars.
Bonds served as a steady anchor for returns as Treasury yields drifted lower on softer inflation prints, leaving the Bloomberg U.S. Aggregate Bond Index marginally positive for the month up 0.9%. Sector rotation favored cyclical groups such as Industrials, Financials and Energy, while equal-weight benchmarks outpaced market cap weighted indices for the first time this year, returning 2.72%. [1]
Profits were the key catalyst. Midway through earnings season, Nasdaq-100 companies reported year-on-year EPS growth of 27%, the fourth straight quarter above 20%. Even more eye-catching, Russell 2000 EPS surged nearly 69%, the highest quarter-over-quarter improvement since 2021. In our view, that breadth of earnings momentum, spanning both mega-cap innovators and leveraged domestic cyclicals, substantiates the “earnings-lift-all-boats” narrative that defined August’s rally. [2] [3]
Conclusion:
Our macro process, anchored by Hedgeye’s regime-based framework, remains forward-looking. The current model’s quarterly 3-2-1 Quad cadence suggests Quad 3 (growth slowing, inflation accelerating) now; Quad 2 (growth & inflation accelerating) in 4Q25; and Quad 1 (growth accelerating, inflation decelerating) by 1Q26. This 3-2-1 setup is often favorable for US equity returns.
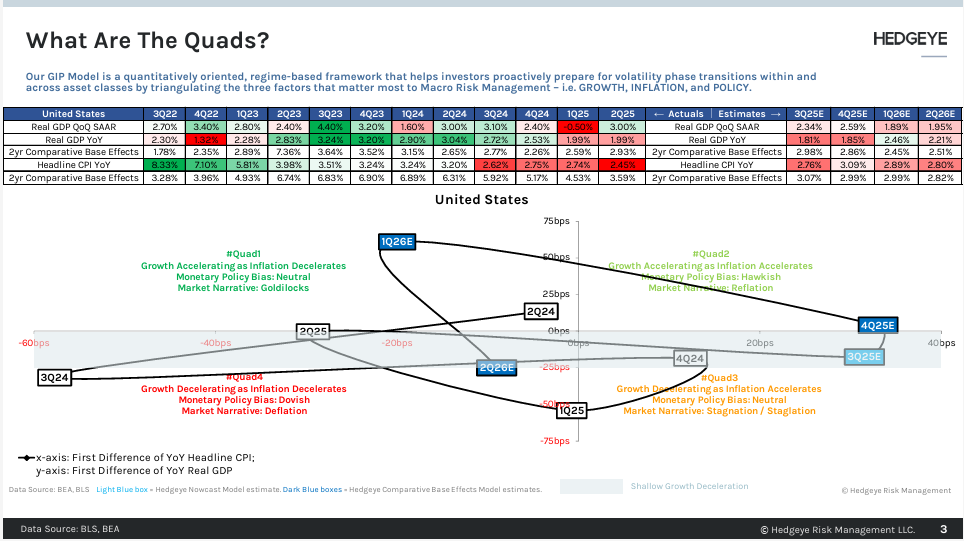
Because regime shifts often usher in new market leaders, we used the August 1st volatility spike to realign portfolios with the projected 3-2-1 Quad path. In Satellite 1, we opened positions in QQQ (Technology), IWM (Small Caps), and XLF (Financials) that day, and later added MGK (Mega-Cap Growth) to reinforce exposure to durable earnings momentum. At the same time, we trimmed XLU (Utilities) and EWG (Germany), holdings that had previously been top performers but are less likely to shine under the forthcoming regime. These moves modestly increased portfolio beta while broadening sector and factor participation, positioning us to capture the next leg of US market momentum and expanding breadth.
Taken together, August’s broadening profit tide, a supportive 3-2-1 macro roadmap, and disciplined risk management give us confidence that our portfolios are well set for the cycle’s next chapter. We will stay agile, so that process, not headlines, continues to steer the course as we finish out the year.
Sources
1. https://marksgroup.com/august-2025-market-recap/
2. https://lipperalpha.refinitiv.com/2025/08/russell-2000-earnings-dashboard-25q2-aug-28-2025/
3. https://www.nasdaq.com/articles/nasdaq-100-index-q2-2025-preliminary-earnings-updates
Model Performance Update
Our Moderate Model Portfolio returned 2.45% during the month of August and has returned 9.21% YTD
Changes to the model portfolio in August
7/31/2025
- Added XLF (Financials) and IWM (Small Cap) to Satellite 1
- Added SIVR (Silver) to Satellite 3
8/1/2025
- Added QQQ (Nasdaq) to Satellite 1
- Increased exposure to IWM (Small Cap) and XLF (Financials) in Satellite 1
- Reduced CTA (Managed Futures) in Satellite 5
- Reduced Exposure to XLU (Utilities) and EWG (Germany) in Satellite 1
8/21/2025
- Added MGK (Mega Cap Growth) to Satellite 1
8/29/2025
- Removed EWG (Germany) from Satellite 1
- Added EWW (Mexico) to Satellite 1
- Increased exposure to MGK (Mega Cap Growth) in Satellite 1
August Performance with Benchmark

YTD Performance with Benchmark

If you were to have any questions regarding the above, please reach out to us to set up a one to one meeting to review your situation.
Sincerely,
Bryant Andrus, MSF, CFP®
President
SBC Investment Management
P: (602) 641-5996
M: (319) 520-2033
E: bandrus@sbcinvestmentmanagement.com
DISCLAIMERS
SBC Investment Management’s Monthly and Quarterly Market Summary and Outlook is intended to communicate current economic and capital market information along with the informed perspectives of our investment professionals. All expressions of opinion are subject to change. Past performance may not be indicative of future results. There is no assurance that any of the trends discussed will continue, or that any of the forecasts will occur.
You should not construe any information in this publication as investment, financial, or any other professional advice. Nothing contained in this publication constitutes a recommendation, endorsement, or an offer to buy or sell any securities or other financial instruments. You should conduct your own research or speak to your investment advisor before investing.
SBC Investment Management prepares this material as a resource for its clients. This content is for informational purposes only and does not address the circumstances of any particular individual or entity. You may contact us to discuss the content of this publication within the context of your own financial situation.
Past performance may not be indicative of future results. Different types of investments involve varying degrees of risk. There can be no assurance that the future performance of any specific investment, investment strategy (including the investments and/or investment strategies recommended or undertaken by SBC Investment Management, LLC), or any non-investment related content, referred to directly or indirectly in this piece will be profitable, equal any corresponding indicated historical performance level(s), or prove successful. Due to various factors, including changing market conditions and/or applicable laws, the content may no longer be reflective of current opinions or positions. Moreover, you should not assume that any discussion or information contained in this piece serves as the receipt of, or as a substitute for, personalized investment advice from SBC Investment Management, LLC. Investment performance results published herein do not include investment advisory fees paid, or any other related account expenses. Performance results compiled solely by SBC Investment Management, LLC, have not been independently verified, and do not reflect the impact of taxes on non-qualified accounts.
Historical performance results for investment indices (provided for general comparison purposes only), strategies, models and/or indicators generally do not reflect the deduction of an investment management fee, nor the impact of taxes, the incurrence of which would have the effect of decreasing historical performance results. It should not be assumed that your account holdings correspond directly to any comparative indices.
Our past recommendations and model portfolio results are not a guarantee of future results. Using any graph, chart, formula, or other device to assist in deciding which securities to trade or when to trade them presents many difficulties and their effectiveness has significant limitations, including that prior patterns may not repeat themselves continuously or on any particular occasion. In addition, market participants using such devices can impact the market in a way that changes the effectiveness of such device.
Hypothetical performance results shown in this report and on sbcinvestmentmanagement.com are backtested and do not represent the performance of any account managed by SBC Investment Management, LLC. They were achieved by means of the retroactive application of each of the previously referenced models, certain aspects of which may have been designed with the benefit of hindsight.
The hypothetical backtested performance does not represent the results of actual trading using client assets nor decision-making during the period and does not and is not intended to indicate the past performance or future performance of any account or investment strategy managed by SBC Investment Management, LLC. If actual accounts had been managed throughout the period, ongoing research might have resulted in changes to the strategy, which might have altered returns. The performance of any account or investment strategy managed by SBC Investment Management, LLC will differ from the hypothetical backtested performance results for each factor shown herein for a number of reasons, including without limitation the following:
Although SBC Investment Management, LLC may consider from time to time one or more of the factors noted herein in managing any account, it may not consider all or any of such factors. SBC Investment Management, LLC may (and will) from time to time consider factors in addition to those noted herein in managing any account.
SBC Investment Management, LLC may rebalance an account more frequently or less frequently than annually and at times other than presented herein.
The hypothetical backtested performance results for each strategy include estimated values for transaction costs of buying and selling securities, which may not be accurate. Investment management fees, custody and other costs, and taxes – all of which would be incurred by an investor in any account managed by SBC Investment Management, LLC are not included in performance results. If such costs and fees were reflected, the hypothetical backtested performance results would be lower.
The hypothetical performance does not reflect the reinvestment of dividends and distributions therefrom, interest, capital gains and withholding taxes.
Accounts managed by SBC Investment Management, LLC are subject to additions and redemptions of assets under management, which may positively or negatively affect performance depending generally upon the timing of such events in relation to the market’s direction.
Simulated returns may be dependent on the market and economic conditions that existed during the period. Future market or economic conditions can adversely affect the returns.
SBC Investment Management, LLC is neither a law firm nor a certified public accounting firm. No portion of our website, our newsletter content, or any other correspondence from us should be construed as legal or accounting advice.