
Can you see the inflation?
Commentary:
Although September is typically a seasonally weak month for equities, we stayed true to our macro process, which now points decisively toward Quad 2 (growth and inflation accelerating into Q4) and remained constructive despite the negative media narrative. That discipline paid off: the S&P 500 advanced 3.5% for the month and almost 14% year-to-date, its best September in fifteen years [1] while inflation hedges from gold to small-caps sprinted ahead.
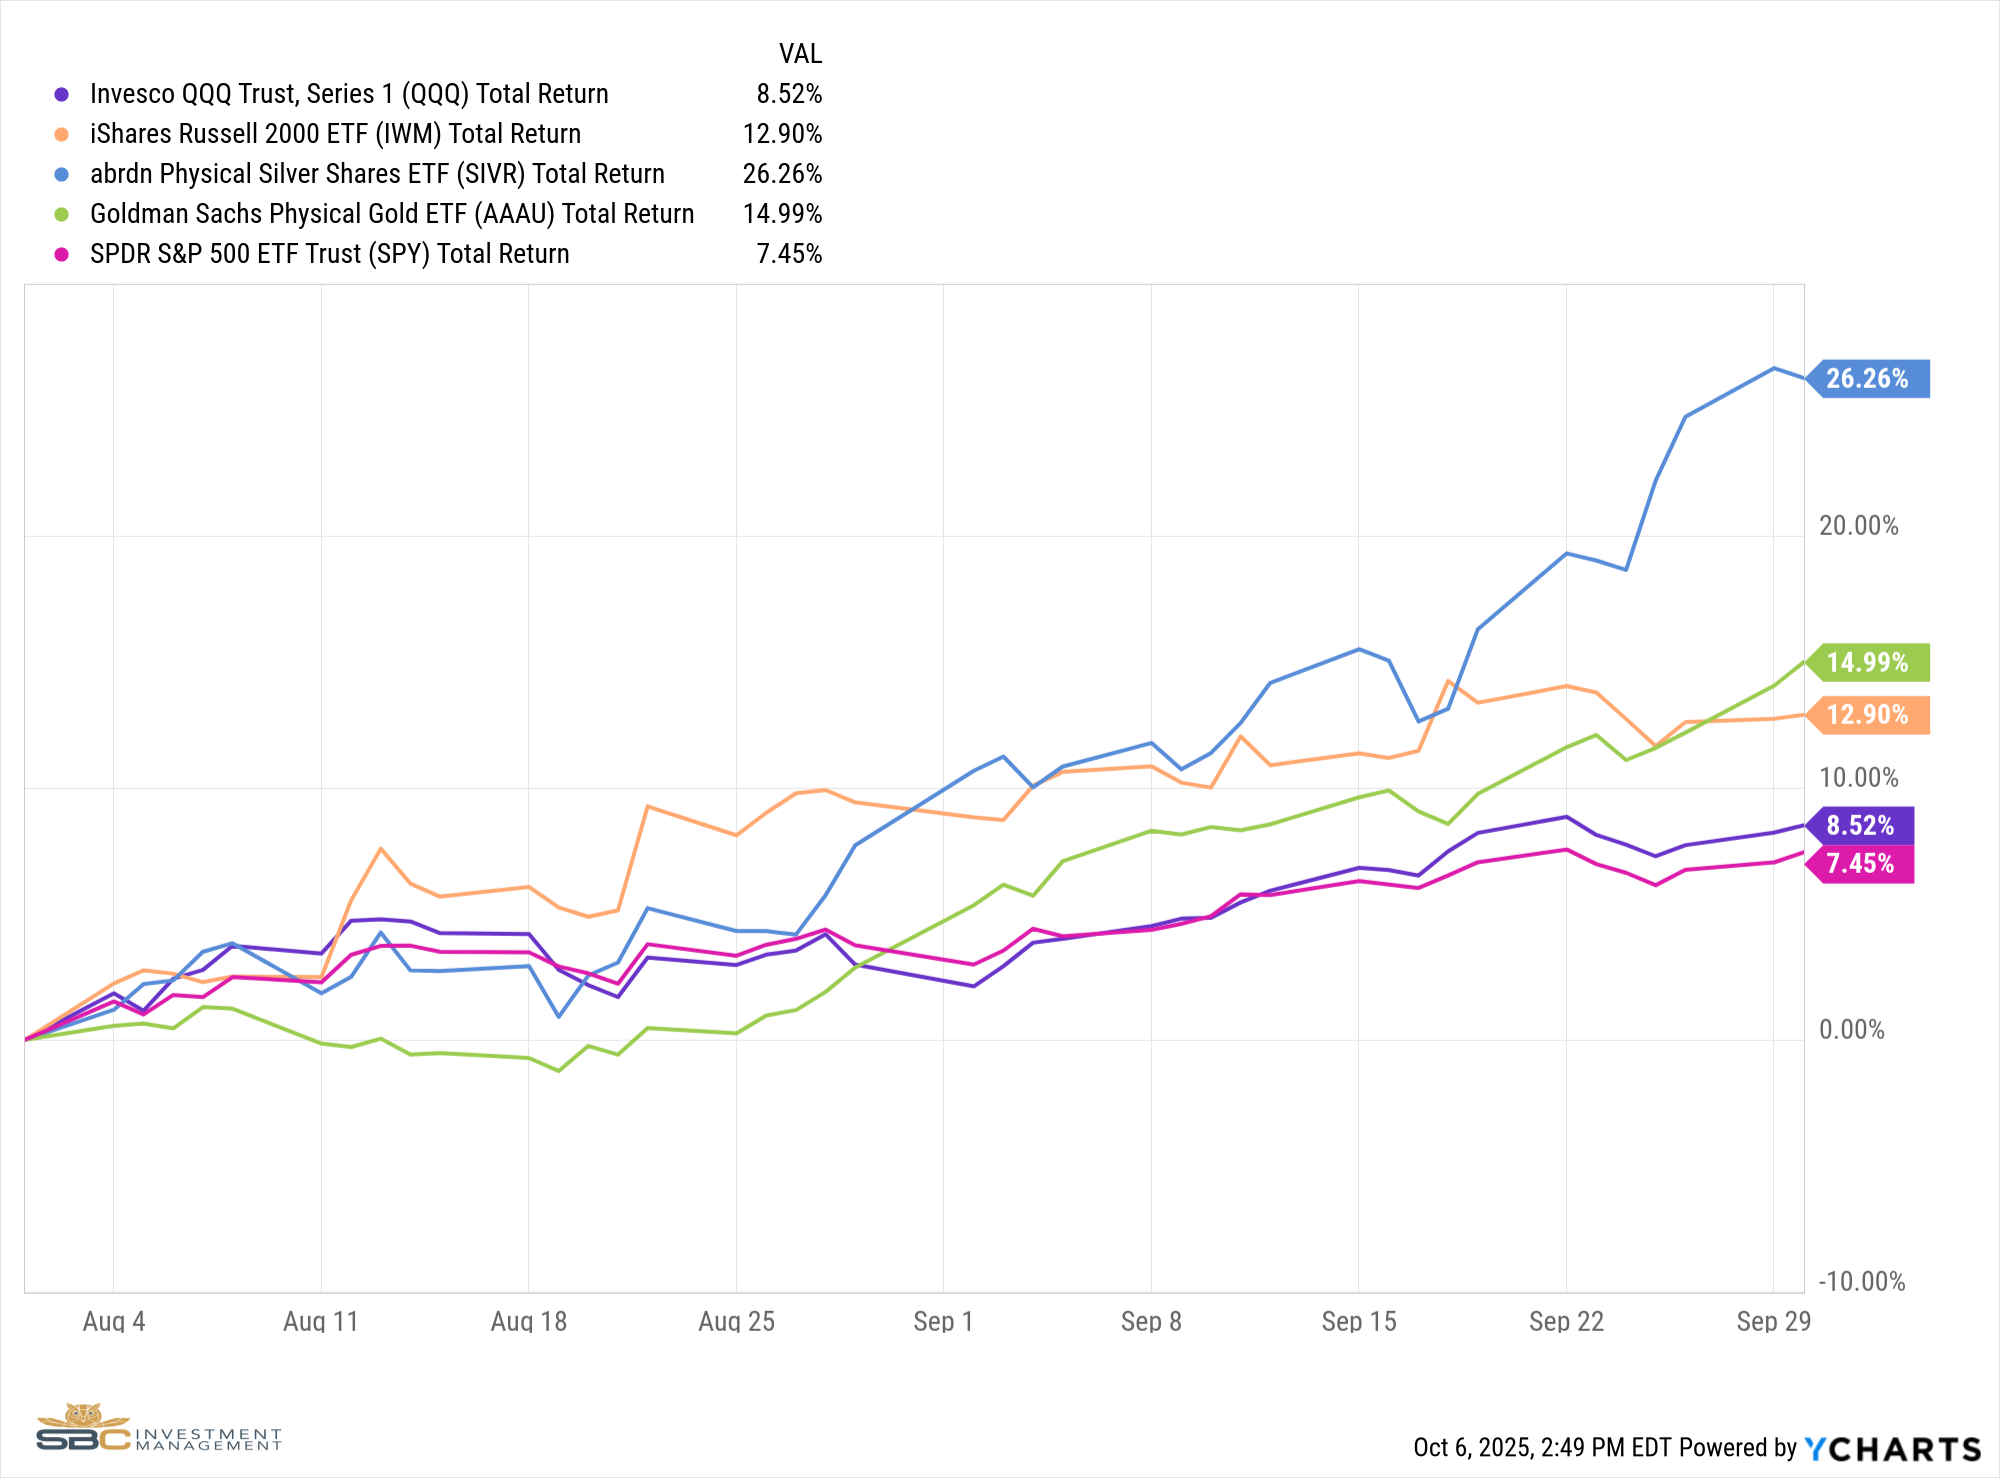
Inflation-sensitive assets stole the show. Gold pierced a record $3,900/oz after a 12% monthly surge, lifting its 2025 gain to roughly 48%. Silver’s rise has been even steeper, up about 55% year-to-date. Equity markets echoed that message: the high-beta Russell 2000 logged its first record close since 2021 on September 18th [2], and AI-heavy mega-caps propelled the Nasdaq to multiple all-time highs, finishing the month up 5.76%. In fixed income, core Treasuries rallied after the Fed’s pivot, but the Bloomberg Agg finished flat as credit spreads widened late-month.
Headline inflation is no longer retreating. August CPI printed a 2.9% year-over-year rate, ticking up towards 3% for the first time since January, with shelter and medical services supplying the heat. Core PCE told a similar story at 2.9%. [3] Even so, the Federal Reserve delivered its first rate cut of the cycle on 17 September, trimming the target range to 4.00–4.25% and projecting two more quarter-point moves by year-end.
Conclusion:
Our strategy continues to be process over narratives. August’s 3-2-1 formation, a sequential shift from Quad 3 (slowing growth, rising inflation) to an anticipated Quad 2 (accelerating growth and inflation) and, ultimately, Quad 1 (growth accelerating, inflation decelerating), drove our decision to overweight Gold, Silver, U.S. Small-Caps, and Mega-Cap Tech. Those allocations have already rewarded the portfolio and, in our view, remain well aligned with the road ahead.
As we enter Quad 2 this quarter, history suggests that real assets, cyclical equities, and high-cash-flow technology continue to lead on both absolute and risk-adjusted terms. Our current exposures are positioned to capture that upside while providing liquidity through the metals sleeve if volatility re-emerges. Looking one step further, the models signal a transition to Quad 1 early next year; here, the same small-cap and tech positions typically maintain momentum, while the metals offer optionality should the dollar weaken.
In short, the 3-2-1 roadmap shaped our August moves, and the portfolio now stands to benefit from both the pro-growth, pro-inflation bias of Quad 2 and the growth-led follow-through of Quad 1. We will continue to let the data guide sizing and risk controls, but for now the signals and the strategy are fully aligned.
Sources
3. https://www.bls.gov/news.release/archives/cpi_09112025.htm?utm
Model Performance Update
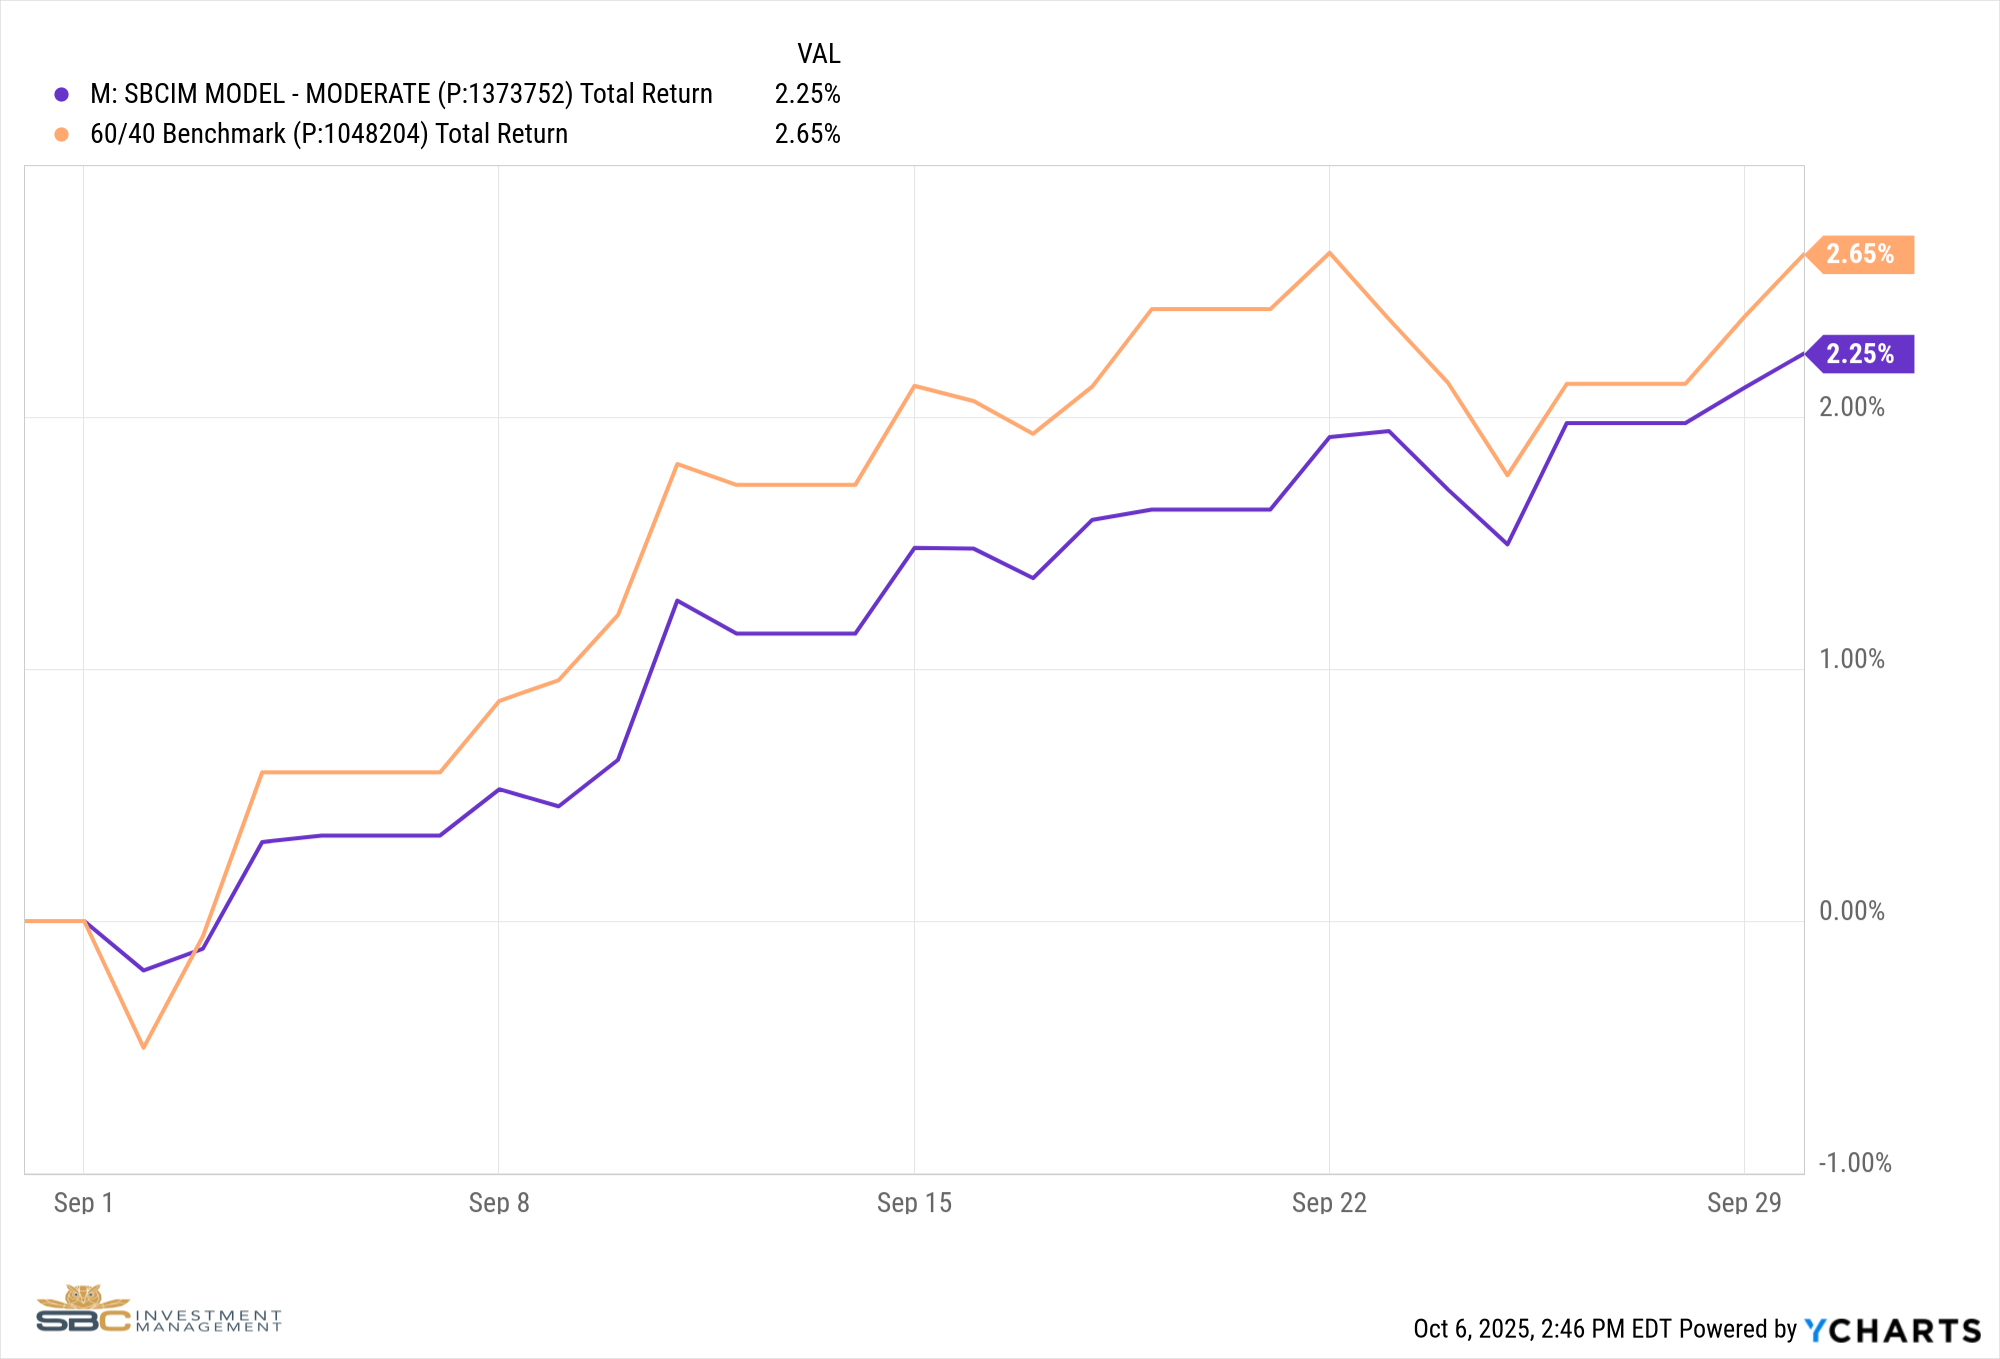
Our Moderate Model Portfolio returned 2.25% in September and has returned 11.67% Year-To-Date
Changes to the model portfolio in September
9/5/2025
- Added RSP (Equal Weight S&P) to Satellite 1
9/12/2025
- Added KRE (Regional Banking) and removed XLU (Utilities) from Satellite 1
9/25/2025
- Removed XLB (Materials) and added PINK (Healthcare) to Satellite 1
- Removed KRE (Regional Banking) and added to XLE (Energy) in Satellite 1
September Performance with Benchmark
YTD Performance with Benchmark

If you were to have any questions regarding the above please reach out to us to set up a one to one meeting to review your situation.
Sincerely,
Bryant Andrus, MSF, CFP®
President
SBC Investment Management
P: (602) 641-5996
M: (319) 520-2033
E: bandrus@sbcinvestmentmanagement.com
DISCLAIMERS
SBC Investment Management’s Monthly and Quarterly Market Summary and Outlook is intended to communicate current economic and capital market information along with the informed perspectives of our investment professionals. All expressions of opinion are subject to change. Past performance may not be indicative of future results. There is no assurance that any of the trends discussed will continue, or that any of the forecasts will occur.
You should not construe any information in this publication as investment, financial, or any other professional advice. Nothing contained in this publication constitutes a recommendation, endorsement, or an offer to buy or sell any securities or other financial instruments. You should conduct your own research or speak to your investment advisor before investing.
SBC Investment Management prepares this material as a resource for its clients. This content is for informational purposes only and does not address the circumstances of any particular individual or entity. You may contact us to discuss the content of this publication within the context of your own financial situation.
Past performance may not be indicative of future results. Different types of investments involve varying degrees of risk. There can be no assurance that the future performance of any specific investment, investment strategy (including the investments and/or investment strategies recommended or undertaken by SBC Investment Management, LLC), or any non-investment related content, referred to directly or indirectly in this piece will be profitable, equal any corresponding indicated historical performance level(s), or prove successful. Due to various factors, including changing market conditions and/or applicable laws, the content may no longer be reflective of current opinions or positions. Moreover, you should not assume that any discussion or information contained in this piece serves as the receipt of, or as a substitute for, personalized investment advice from SBC Investment Management, LLC. Investment performance results published herein do not include investment advisory fees paid, or any other related account expenses. Performance results compiled solely by SBC Investment Management, LLC, have not been independently verified, and do not reflect the impact of taxes on non-qualified accounts.
Historical performance results for investment indices (provided for general comparison purposes only), strategies, models and/or indicators generally do not reflect the deduction of an investment management fee, nor the impact of taxes, the incurrence of which would have the effect of decreasing historical performance results. It should not be assumed that your account holdings correspond directly to any comparative indices.
Our past recommendations and model portfolio results are not a guarantee of future results. Using any graph, chart, formula, or other device to assist in deciding which securities to trade or when to trade them presents many difficulties and their effectiveness has significant limitations, including that prior patterns may not repeat themselves continuously or on any particular occasion. In addition, market participants using such devices can impact the market in a way that changes the effectiveness of such device.
Hypothetical performance results shown in this report and on sbcinvestmentmanagement.com are backtested and do not represent the performance of any account managed by SBC Investment Management, LLC. They were achieved by means of the retroactive application of each of the previously referenced models, certain aspects of which may have been designed with the benefit of hindsight.
The hypothetical backtested performance does not represent the results of actual trading using client assets nor decision-making during the period and does not and is not intended to indicate the past performance or future performance of any account or investment strategy managed by SBC Investment Management, LLC. If actual accounts had been managed throughout the period, ongoing research might have resulted in changes to the strategy, which might have altered returns. The performance of any account or investment strategy managed by SBC Investment Management, LLC will differ from the hypothetical backtested performance results for each factor shown herein for a number of reasons, including without limitation the following:
Although SBC Investment Management, LLC may consider from time to time one or more of the factors noted herein in managing any account, it may not consider all or any of such factors. SBC Investment Management, LLC may (and will) from time to time consider factors in addition to those noted herein in managing any account.
SBC Investment Management, LLC may rebalance an account more frequently or less frequently than annually and at times other than presented herein.
The hypothetical backtested performance results for each strategy include estimated values for transaction costs of buying and selling securities, which may not be accurate. Investment management fees, custody and other costs, and taxes – all of which would be incurred by an investor in any account managed by SBC Investment Management, LLC are not included in performance results. If such costs and fees were reflected, the hypothetical backtested performance results would be lower.
The hypothetical performance does not reflect the reinvestment of dividends and distributions therefrom, interest, capital gains and withholding taxes.
Accounts managed by SBC Investment Management, LLC are subject to additions and redemptions of assets under management, which may positively or negatively affect performance depending generally upon the timing of such events in relation to the market’s direction.
Simulated returns may be dependent on the market and economic conditions that existed during the period. Future market or economic conditions can adversely affect the returns.
SBC Investment Management, LLC is neither a law firm nor a certified public accounting firm. No portion of our website, our newsletter content, or any other correspondence from us should be construed as legal or accounting advice.