
TL;DR
● Volatility returned in October: the VIX, a gauge of expected stock market swings, rose from about 15 to near 20 by mid-month, and the Nasdaq had its worst month in more than a year, even as the S&P 500 lost less than 1%.
● History suggests some of that is the election calendar: since 1990, volatility has tended to build into October of a midterm year and ease around Election Day, and the S&P 500 was higher twelve months after Election Day in each of the nine midterm cycles, though nine is a small sample.
● The shape of the selling matters too: long-term Treasuries rallied, energy and defensive sectors led and technology lagged, a pattern consistent with investors expecting growth and inflation to slow together.
● Our macro framework has the economy still accelerating in the near term, with November leaning Quad 1, and points to slowing growth in early 2027.
● We read October as partly election-calendar volatility and partly an early look at 2027. A rebound after the vote would fit the near-term picture, though it is not assured, and we are watching for confirmation.
A Quiet Start, a Sharp Finish
October started quietly. The VIX closed the first week of the month at 15.31 and the second week at 14.84. Then it jumped, ending the week of October 16 at 19.99, and it stayed between 19 and 20 at each weekly close through month-end, finishing October at 19.42. A September inflation report showing consumer prices up 3.7% from a year earlier, renewed worries about how artificial intelligence spending will be financed, and a roughly 13% jump in Brent crude oil for the month kept investors on edge. The Federal Reserve held rates at 3.75% to 4.00% on October 28, with two of its twelve voting members favoring an increase.
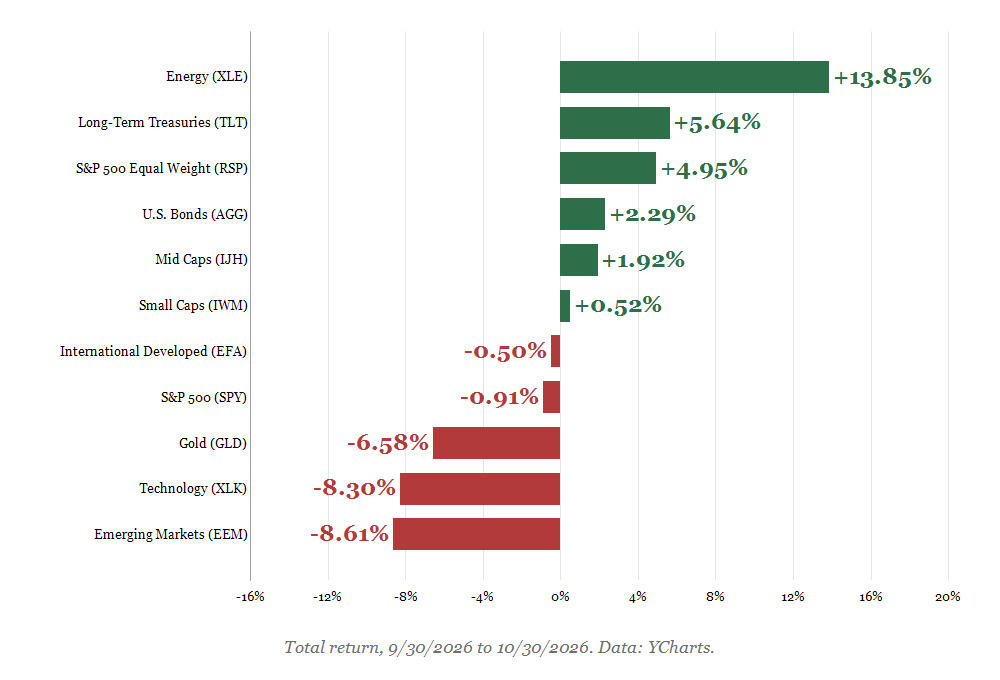
Some of the month's sharpest moves came at the end. Alphabet fell 12.6% on October 29 after reporting about $51 billion of capital spending for the quarter and negative free cash flow. On October 30, Intel fell about 29% and the Nasdaq dropped 2.9%, leaving it down more than 5% for October, its worst month in more than a year. Yet the S&P 500 lost less than 1% for the month, and many parts of the market rose.
October 2026 Total Returns (Data: YCharts)
What Midterm Years Usually Do to Volatility
Some of October's unease fits a familiar pattern. Plante Moran's review of the nine midterm election years since 1990 found that volatility typically builds through late summer, peaks in October, then declines sharply around Election Day and eases through year-end.[1] The usual explanation is that markets dislike not knowing, and an election is a known date on which a great deal of uncertainty gets resolved at once.
Volatility Typically Ramps Up Into Midterms (Source: Plante Moran)
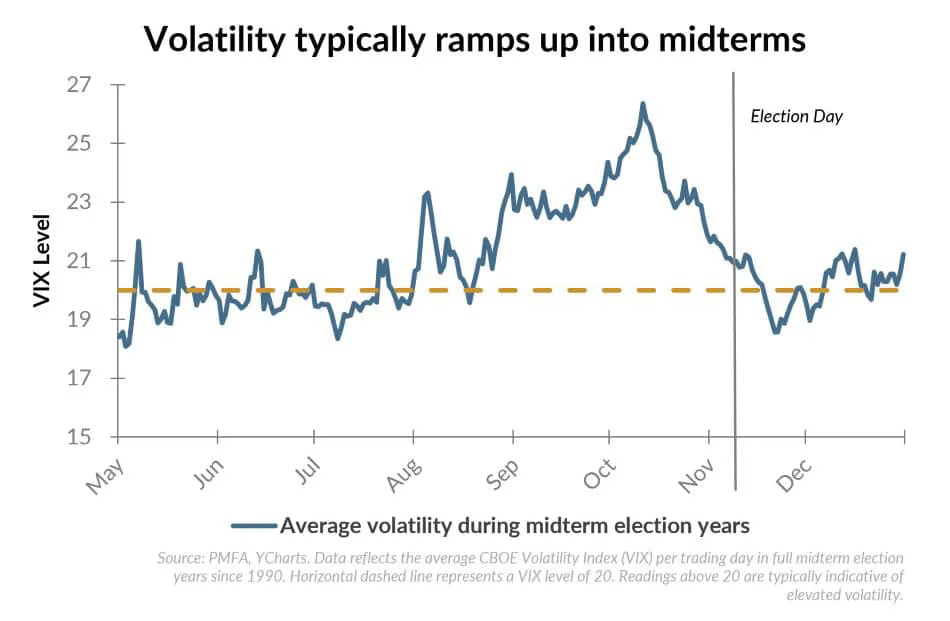
The St. Louis Fed found the same tendency in the VIX. From two days before to three days after Election Day, the VIX has fallen on average after both kinds of election, by 15% after presidential elections and by a smaller 7.3% after midterms.[2] The longer record also looks favorable. Midterm years have been the weakest of the four-year presidential cycle since 1990, averaging a 2.8% return for the year, but the S&P 500 was higher twelve months after Election Day in all nine midterm cycles since 1990, with an average total return of 16.9% over those twelve months.[3] In the three midterm years when stocks were down for the year heading into the vote, the market bottomed between October 9 and October 12, weeks before Election Day.[3]
History is a guide, not a promise, and nine cycles is a small sample. But it suggests that some of October's volatility was the election calendar doing what it usually does, and that the weeks after the vote have tended to be calmer.
Where the Money Went
The election cannot explain everything. What stands out about October is where the money went. Long-term Treasuries rallied, with TLT up 5.64%, and the 10-year Treasury yield fell from 5.29% at the end of September to 4.94% at the end of October[4], even as two Fed officials voted for a rate increase. Energy led the market, followed by consumer staples, utilities and health care, historically steadier parts of the market. Technology stocks, measured by XLK, fell 8.30% after leading in September.
Our macro framework is built on the growth-and-inflation "Quad" model from Hedgeye Risk Management, the independent research firm we have referenced in past letters. It sorts each month by whether growth and inflation are accelerating or slowing. Quad 1 is growth up and inflation down, Quad 2 is both rising, Quad 3 is growth slowing while inflation rises, and Quad 4 is both slowing. Falling yields, steadier sectors leading and weakness in the fastest-growing companies are consistent with investors expecting growth and inflation to slow together, the environment the framework calls Quad 4.
As of November 2, the framework shows two different time horizons. The near term still points to acceleration: the Quad model's monthly reading leans Quad 1 for November. The longer view turns, pointing to slowing growth in early 2027. Earnings estimates point the same way. Consensus estimates via FactSet call for S&P 500 earnings to grow 28.4% from a year earlier in the fourth quarter of 2026 and 19.2% in the first quarter of 2027, before growth slows to just 2.8% in the second quarter[5], which we read as partly a comparison against 2026's strong results.
So which was October: election nerves, or the market starting to price 2027 early? We think it was some of both. The jump in volatility came in mid-October, after the inflation report and amid the AI financing worries. But the pattern of what rose and what fell looks like a market that was looking past the next two months. Other signals did not fit that read: oil prices rose sharply, and as of October 30 interest-rate futures still pointed to a rate increase on December 9 as more likely than not, both signs of an economy still running hot. Markets tend to look ahead, and in October they seemed to be doing so in fits and starts.
What We Are Watching Into Year-End
If history holds, the weeks after November 3 may bring some relief as election uncertainty clears. A bounce would also fit our near-term reading, since our framework still has growth accelerating in the near term, and the first estimate of third-quarter growth came in at a 3.4% annualized rate.[6]
The harder question is when the market turns its attention back to 2027. Our framework does not show growth slowing until early 2027. Markets may begin to discount that change before it shows up in the data, and estimates for the first quarter of 2027 will come into focus as the year closes. The signs we are watching are long-term yields falling while the Fed holds, defensive sectors outperforming on up days as well as down days, and earnings estimates for 2027 coming down.
How the Moderate Model Is Positioned
Holdings in the steadier parts of the market, including dividend and health care funds, along with long-term Treasuries, helped the Moderate model in October, though bond prices generally fall when interest rates rise. Our fundamentally weighted U.S. core holding, which weights companies by measures such as sales, cash flow, dividends and book value rather than market size, also rose. Not everything worked. Our gold, gold miner and emerging markets holdings were the largest drag on the month, and our large-cap growth holding also fell.
In the October letter we wrote that technology and the largest companies looked likely to keep leading. Technology led in September, and by month-end the Moderate model held it in its satellite holdings, though the model held far less technology than the 60/40 benchmark, partly because our core holdings tilt toward value. In early October, the Quad model's monthly reading still pointed to accelerating growth: Quad 2 for October, with Quad 1 expected for November. Those are environments in which we would normally expect faster-growing companies to lead, so we added to our growth exposure on 10/12, moving from a health care fund into large-cap growth. October did not deliver that kind of market. Technology fell 8.30% and defensive sectors, health care among them, led, a pattern that looked more like the slowdown the framework expects in early 2027 than the acceleration it showed for October.
Why the gap between the signal and the market? We see two likely explanations, and we cannot yet say which mattered more: the volatility that typically builds before a midterm election, and investors beginning to price the 2027 slowdown early. It is also possible the signal simply did not carry over to market leadership this time. Third-quarter growth, at a first-estimate 3.4% annualized rate, was consistent with the acceleration reading, but the market looked past it. The Portfolio Changes below list each October trade. We are watching for confirmation and are prepared to adjust the model if the evidence shifts.
An election has a date, and the market's unease around it has usually faded soon after. The economic cycle keeps its own schedule, and it is the clock we are watching most closely as 2027 approaches.
Sources
[3] https://get.ycharts.com/resources/blog/midterm-election-market-response/
[6] https://www.bea.gov/news/2026/gdp-advance-estimate-3rd-quarter-2026
Model Performance Update
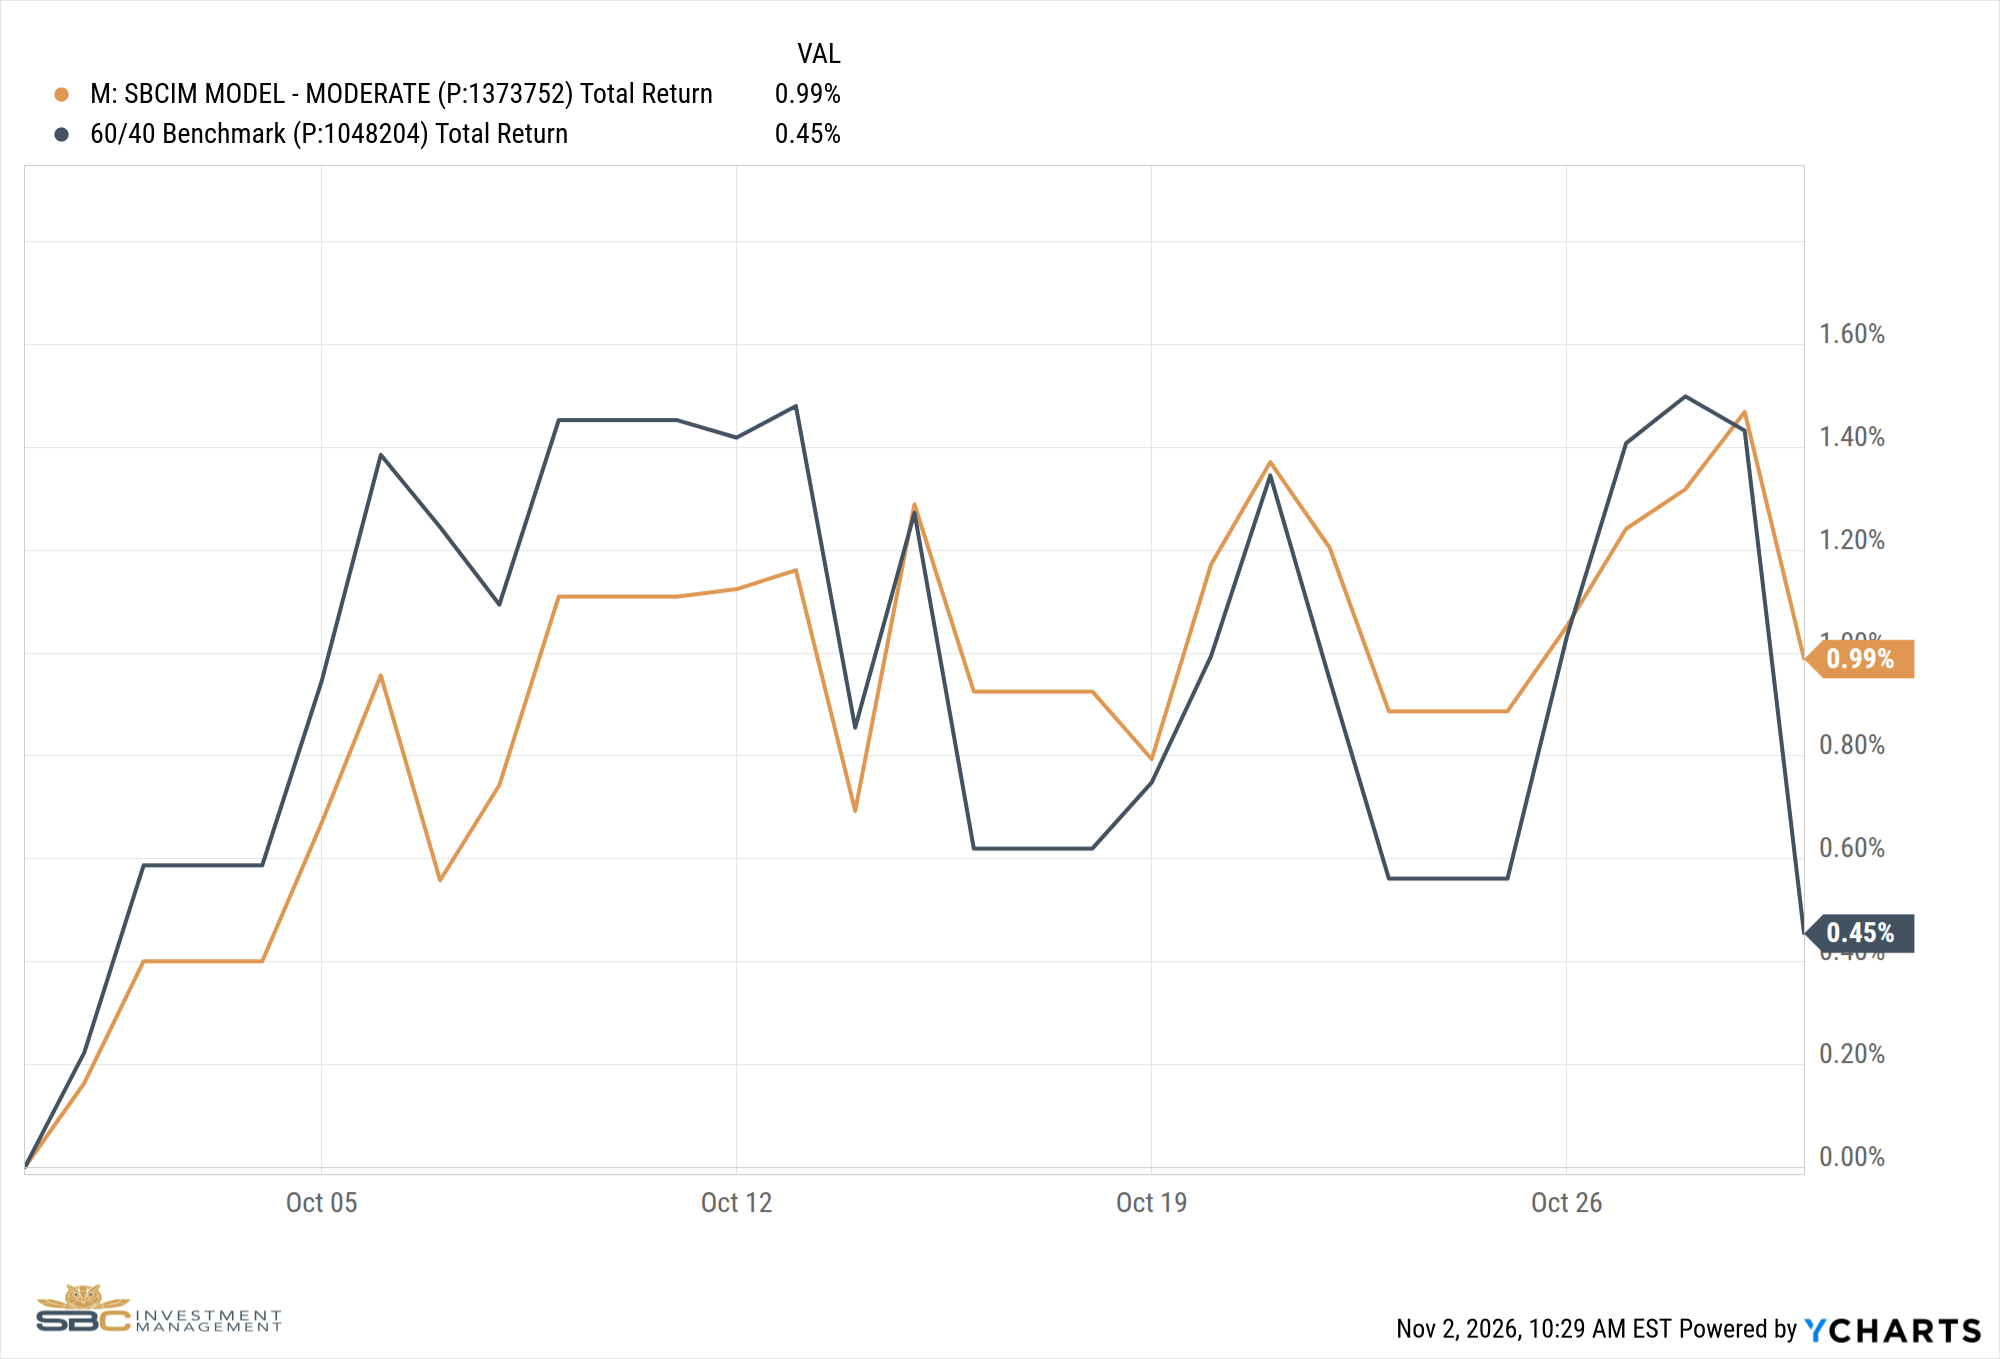
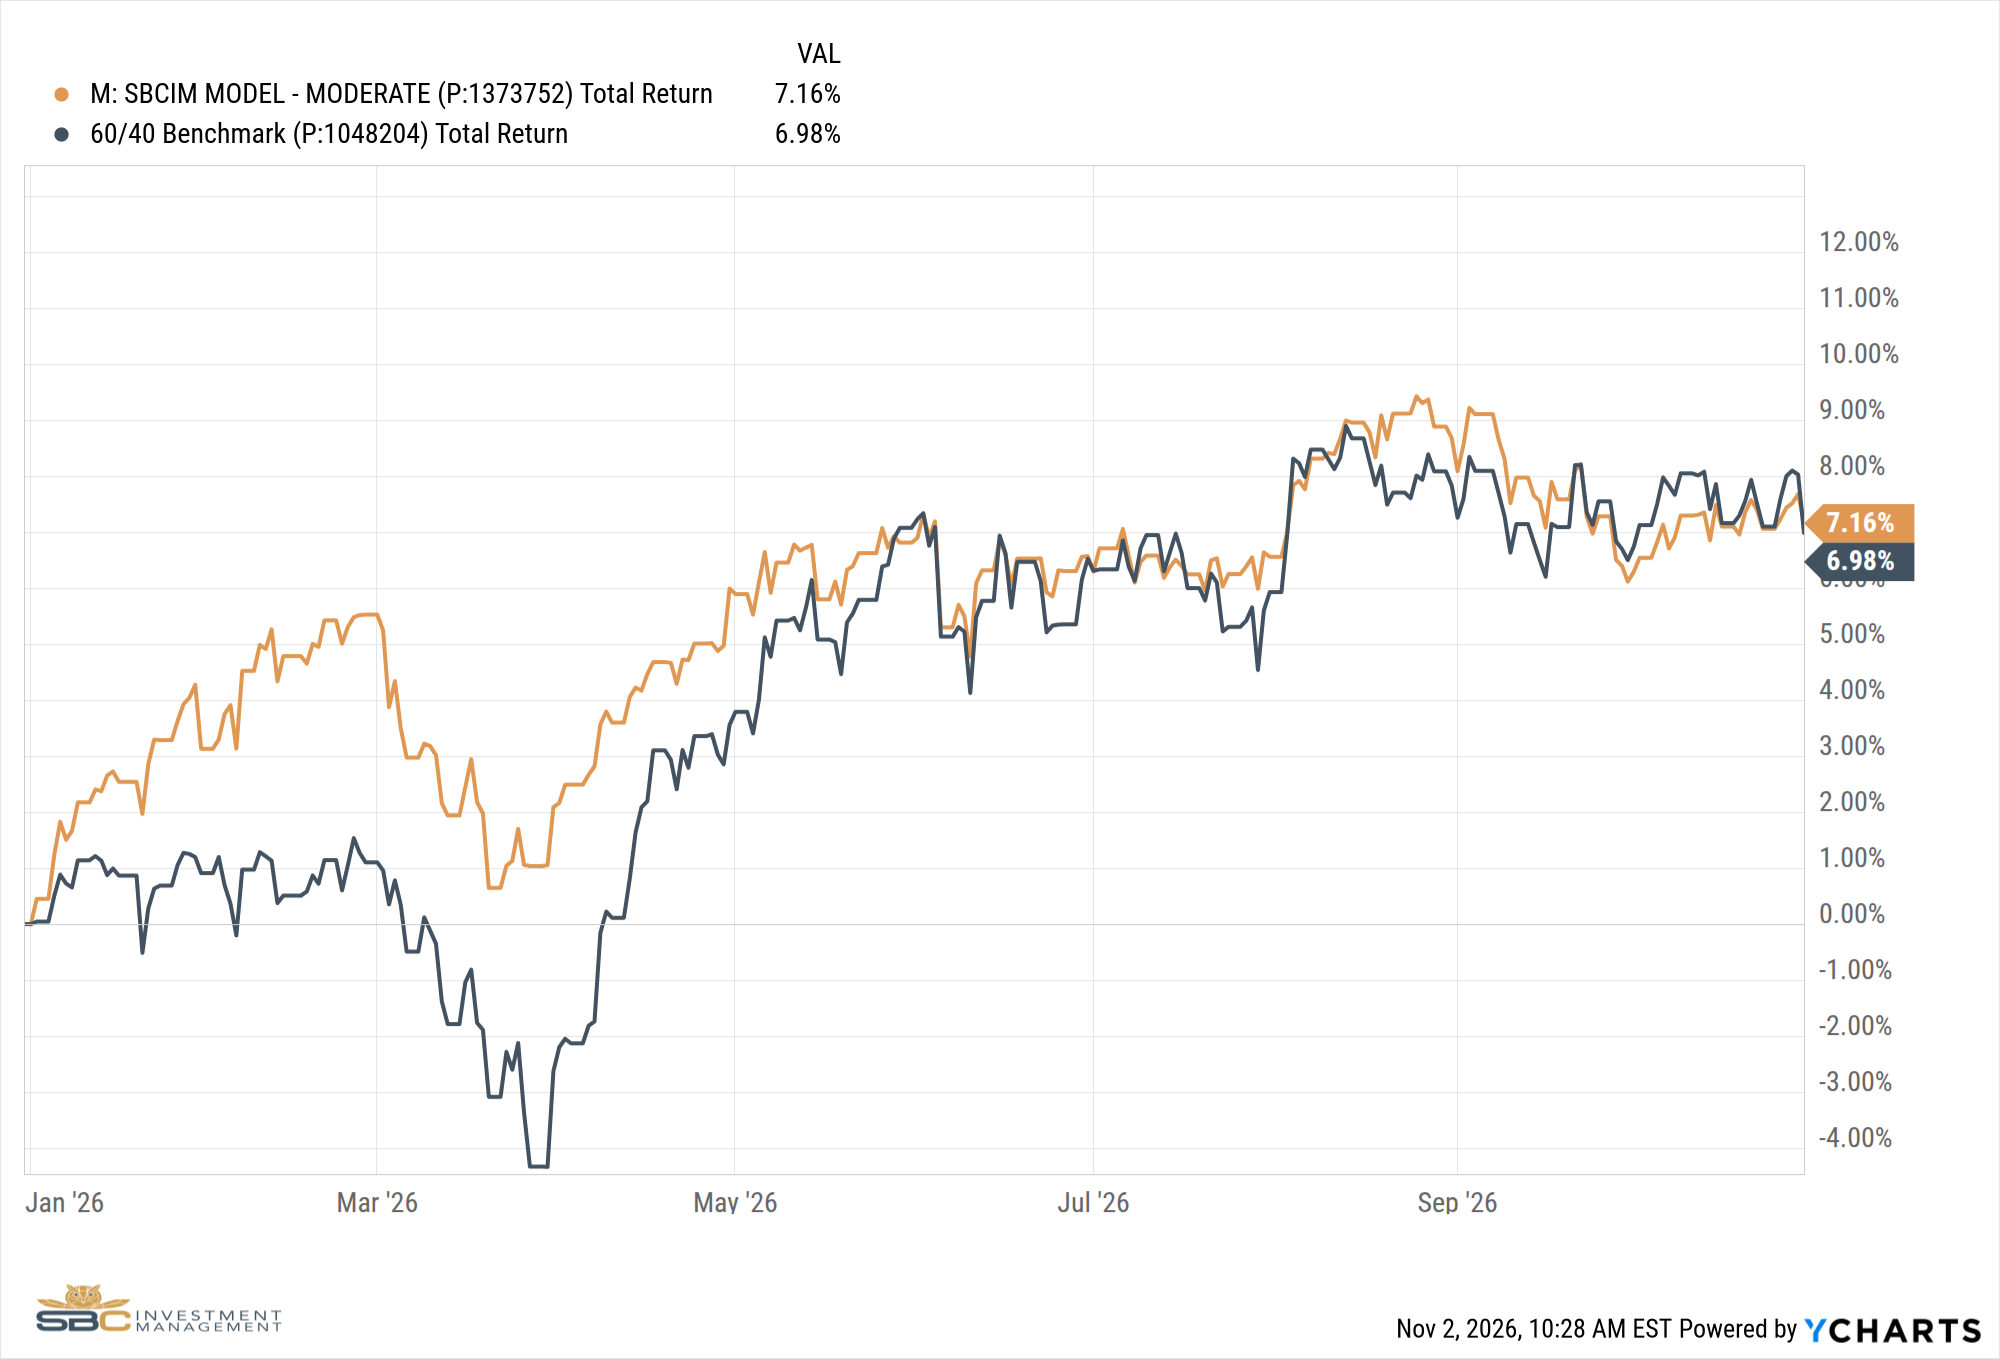
Our Moderate Model Portfolio returned 0.99% in October and has returned 7.16% YTD, versus the 60/40 Benchmark's 0.45% in October and 6.98% YTD.
Returns shown are for the SBCIM Moderate model portfolio, gross of advisory fees, and do not represent any actual client account. Client portfolios may be customized and pay different fees, so individual results will vary. The 60/40 Benchmark is 60% S&P 500 and 40% Bloomberg US Aggregate Bond Index.
Portfolio Changes — October 2026
10/12/2026
● Sold FXH (Health Care AlphaDEX ETF) in Satellite 1
● Bought QQQ (Nasdaq-100 ETF) in Satellite 1 with the proceeds
10/20/2026
● Sold QQQ (Nasdaq-100 ETF) and trimmed XLK (Technology) in Satellite 1
● Bought DJIA (Dow 30 Covered Call ETF) in Satellite 1 with the proceeds
● Sold JEPI (JPMorgan Equity Premium Income ETF) and trimmed XYLD (S&P 500 Covered Call ETF) in Satellite 4
● Bought SEPI (Shelton Equity Premium Income ETF) in Satellite 4 with the proceeds
10/22/2026
● Sold XLK (Technology) and CRTC (National Critical Technologies) in Satellite 1
● Added proceeds to FDRXX (Money Market) in Satellite 1
10/26/2026
● Sold FDRXX (Money Market) in Satellite 1
● Bought LVHI (International Low Volatility High Dividend ETF) and XLP (Consumer Staples) in Satellite 1 with the proceeds
10/29/2026
● Sold SIVR (Physical Silver ETF) in Satellite 3
● Added proceeds to FDRXX (Money Market) in Satellite 3
October Performance with Benchmark
YTD Performance through October with Benchmark
If you have any questions about the above, please reach out to us to set up a one-to-one meeting so we can review your situation.
Sincerely,
Bryant Andrus, MSF, CFP®
President
SBC Investment Management
P: (602) 641-5996 · M: (319) 520-2033 · E: bandrus@sbcinvestmentmanagement.com
Jake Rehkop
Investment Analyst, Junior Portfolio Manager
SBC Investment Management
P: (435) 775-2950 · M: (435) 590-8317 · E: jrehkop@sbcinvestmentmanagement.com