
Turmoil Underneath the Covers
TL;DR
● The S&P 500 slipped just 0.33% in September, but 387 of its 499 members fell, the typical stock lost nearly 6%, and Technology was the only one of eleven sectors to finish higher.
● The equal-weight S&P 500 (RSP) fell 4.83%, its third-widest monthly gap versus the cap-weighted index since 2003, and it is on pace for a seventh straight weekly decline, a streak seen only twice since 1990.
● History treats breadth this narrow as a caution flag rather than a sell signal: forward returns have been positive on average but more modest than usual, and long stretches of equal-weight underperformance have eventually given way to multi-year catch-ups for the broader market.
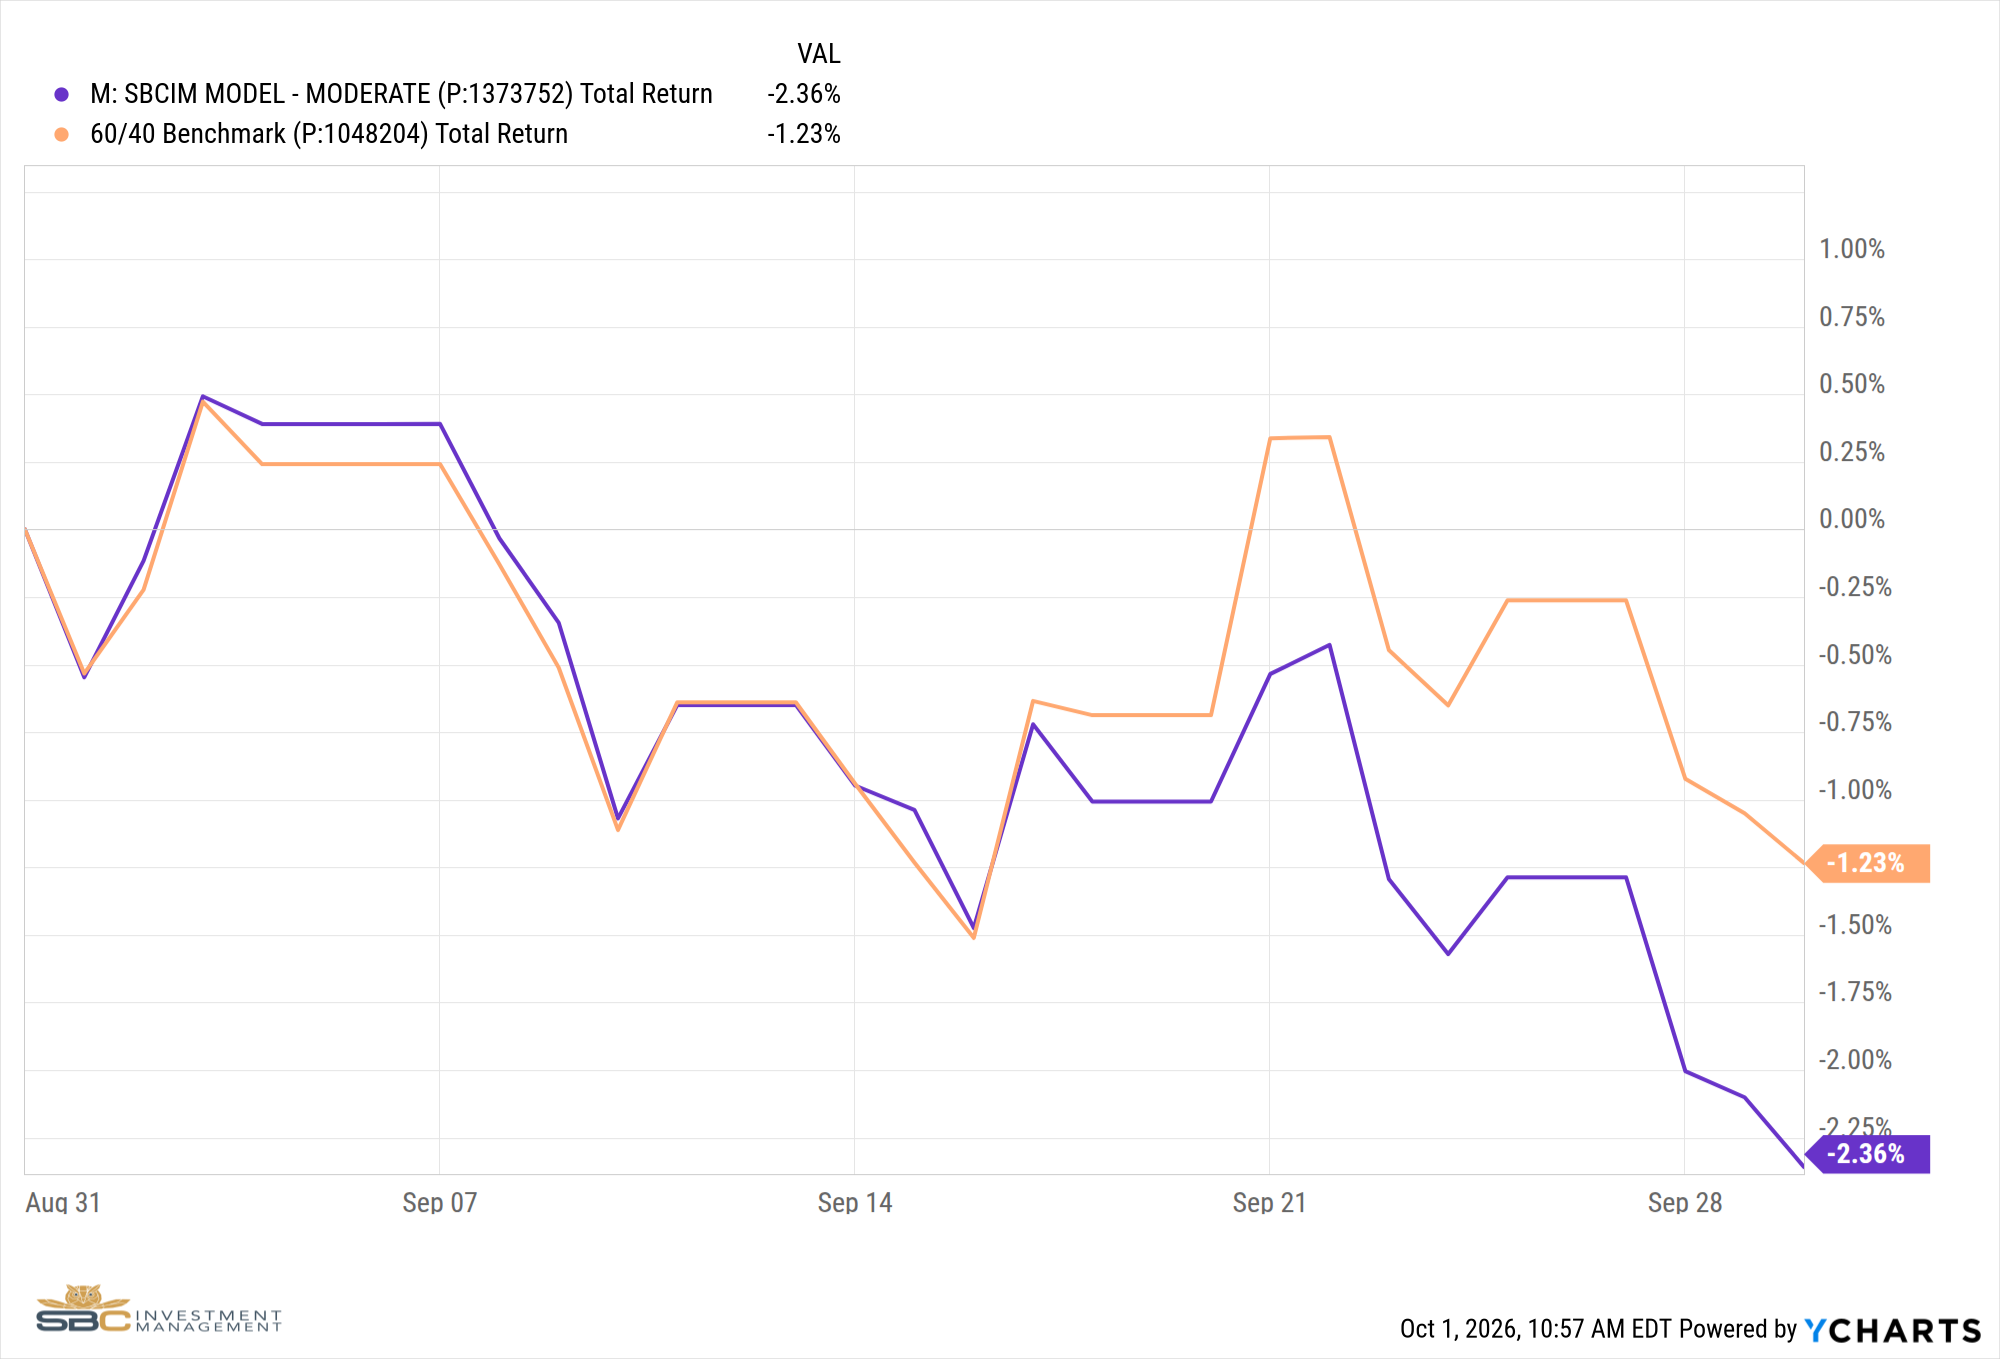
● Our signals moved us out of RSP and VXF on 9/3, ahead of further declines of 5.11% and 4.18% in those funds, but with small caps, international stocks, bonds, and gold all falling together, our Moderate model returned -2.36% versus -1.23% for the 60/40 benchmark.
● Technology and mega caps look likely to keep leading in the months ahead, and we hold that exposure through VOOG, XLK, BUG, and CRTC, but with earnings growth expected to slow sharply in the first half of 2027, we want to participate in the upside without taking on too much risk.
A Flat Index, A Falling Market
The S&P 500 finished September down just 0.33% on a total return basis, a month that looks uneventful on a statement. Underneath, it was anything but. Of the index's 499 members, 387 fell during the month, and the typical stock lost nearly 6%.[1] Technology was the only one of the eleven S&P 500 sectors to post a gain, with the Technology Select Sector SPDR (XLK) up 5.08%, while Financials and Materials each fell more than 7%. A small group of AI and semiconductor names did the heavy lifting: Meta rose 27% after launching its Muse AI agent app on September 8, and chipmakers such as Intel, up 34%, and AMD surged alongside it.
Rates drove most of the damage everywhere else. An escalation between the U.S. and Iran pushed Brent crude above $100 a barrel on September 9, and on September 16 the Federal Reserve raised its target range by a quarter point to 3.75% to 4.00%, its first hike since 2023. A weak $70 billion five-year Treasury auction on September 23 added to the pressure, and the 10-year Treasury yield finished the month near 5.3%, up more than half a percentage point and closing above its 2007 peak at the highest level since 2002. Rising borrowing costs tend to weigh hardest on smaller, more indebted, and rate-sensitive businesses, and those areas were among September's biggest losers.
Breadth at a Historic Extreme
The clearest way to see the gap is to compare the S&P 500 with its equal-weight version, RSP, which holds the same companies, each at an equal weight. In September, RSP fell 4.83% while SPY slipped 0.33%. Bespoke Investment Group notes that since both funds began trading in 2003, there have been only two months, March 2020 and March 2023, when the equal-weight fund trailed by a wider margin.[2]
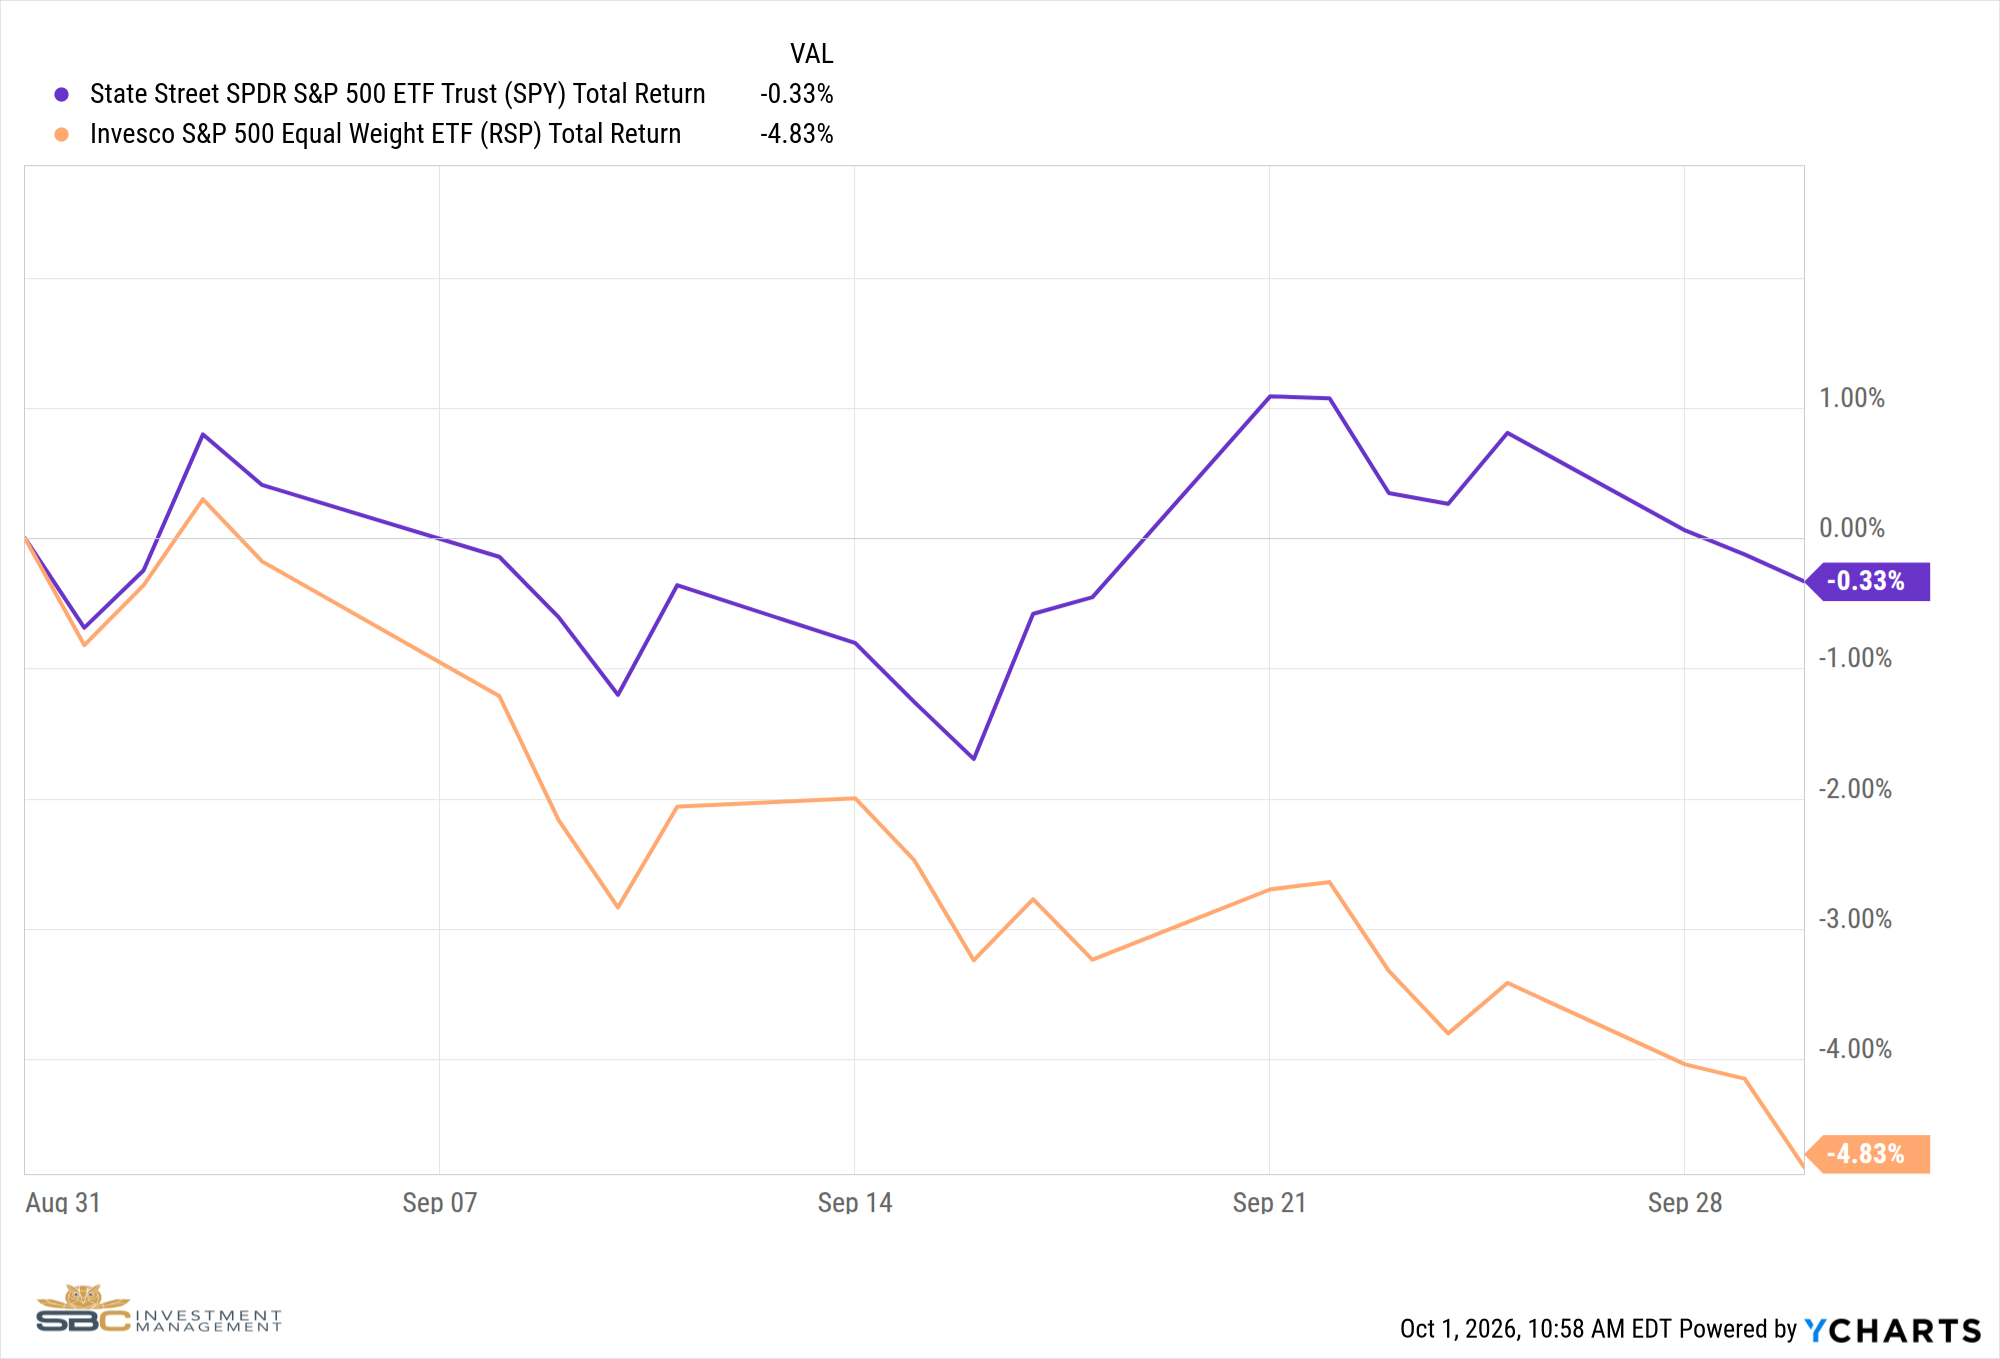
S&P 500 (SPY) vs. Equal-Weight S&P 500 (RSP), September 2026
The reversal was fast. Through August, RSP was ahead of the S&P 500 for the year, 15.46% to 13.08%, the broadening we wrote about in last month's letter. One month later it trails, 9.88% to 12.71%.
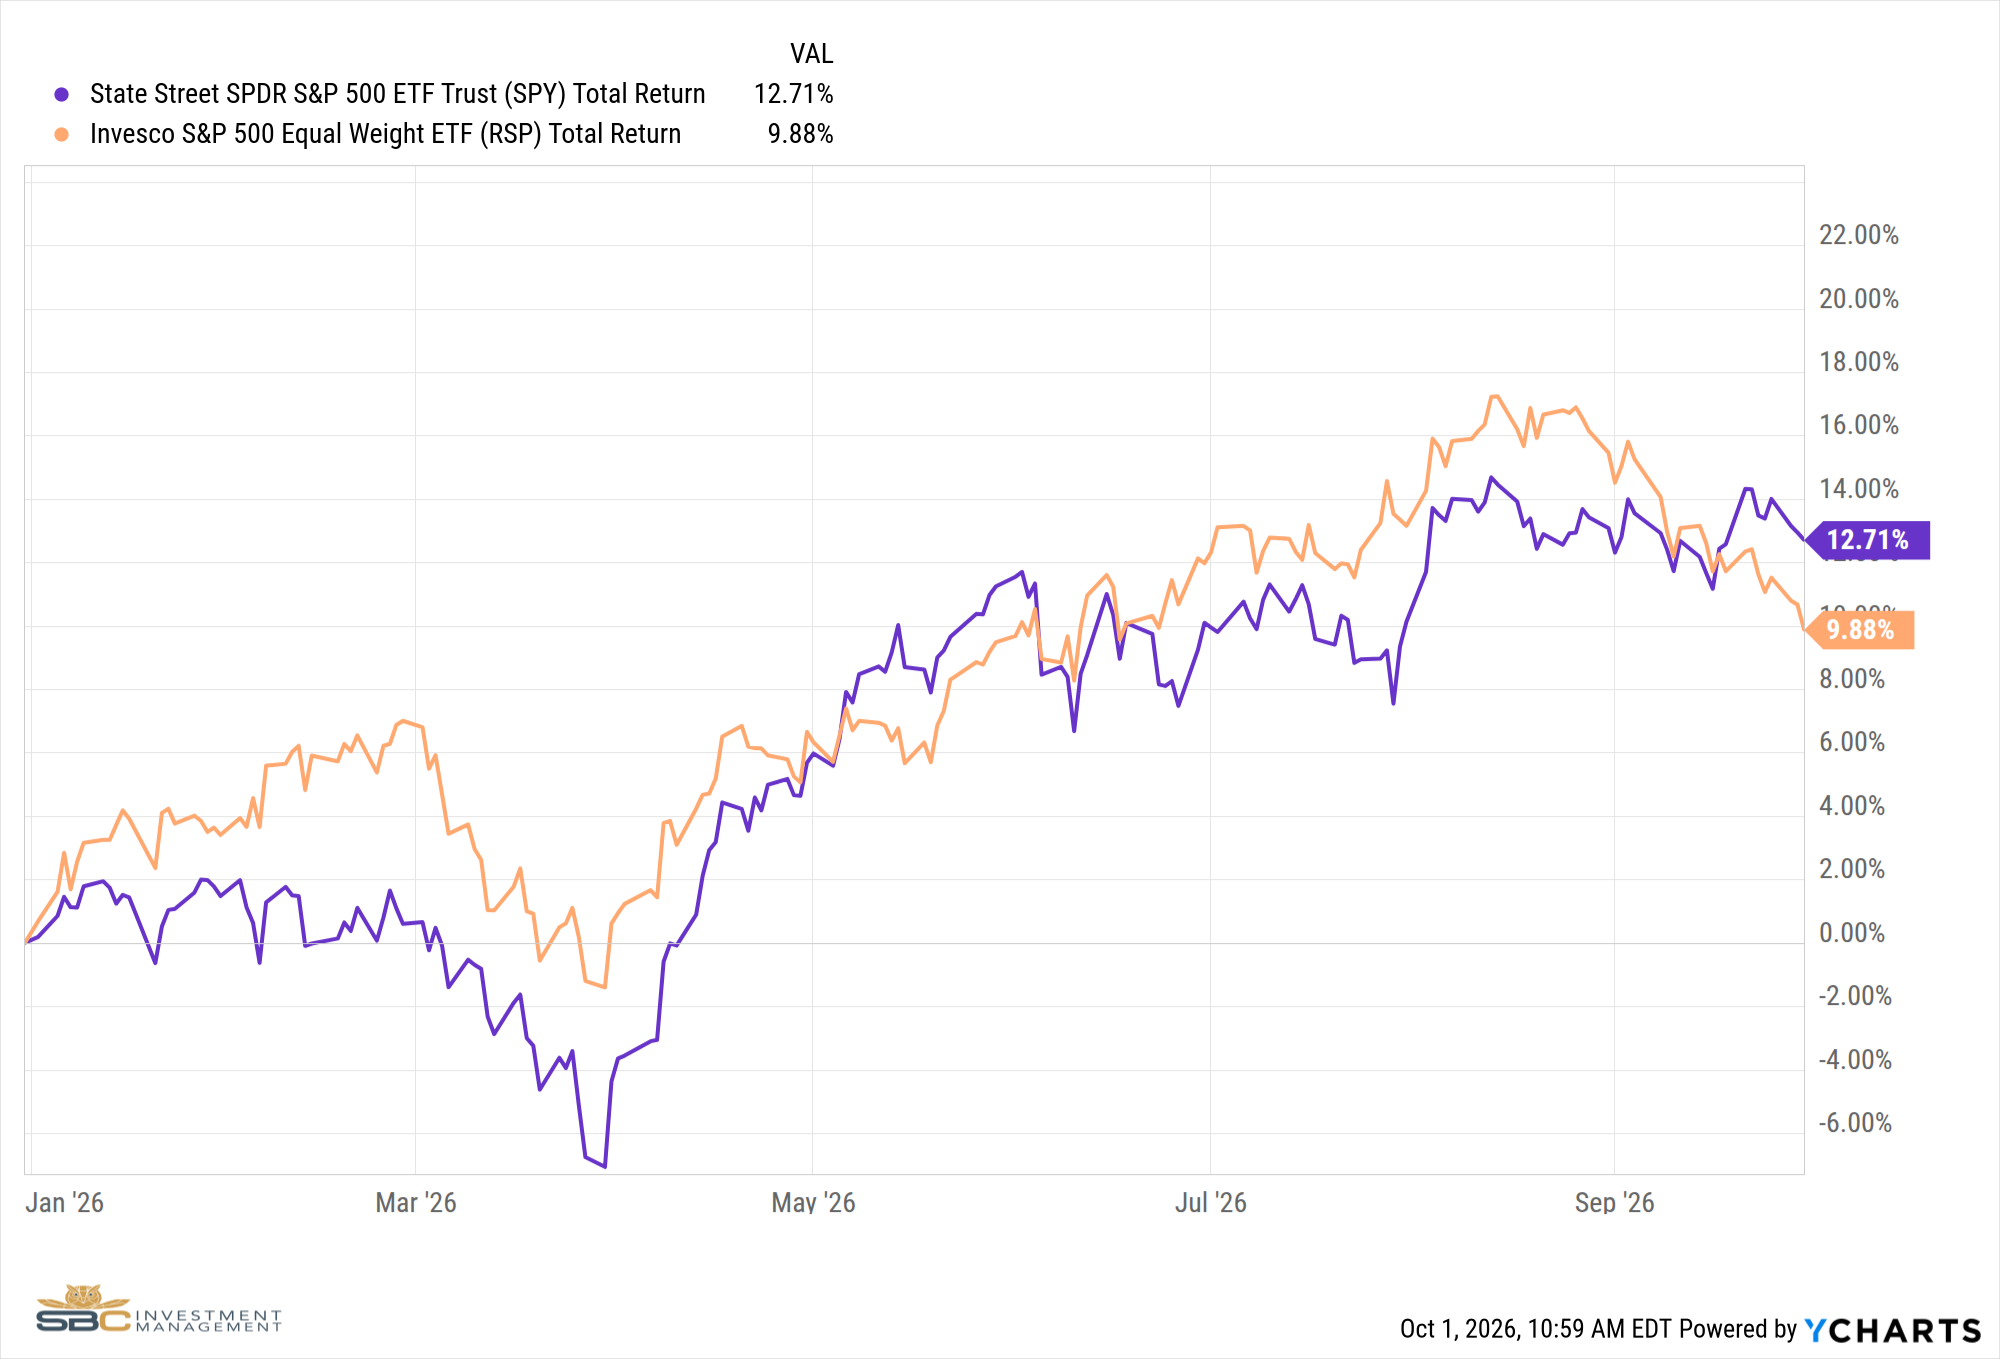
SPY vs. RSP, Year to Date
Other measures tell the same story. The equal-weight index has now fallen six weeks in a row and is on pace for a seventh, a losing streak that Bloomberg data show has happened only twice since 1990, during the 2002 and 2022 bear markets. What makes this one unusual is that the cap-weighted S&P 500 sits within about 2% of its August record. As of late September, only 27.4% of S&P 500 stocks traded above their 50-day moving averages, a record low for an index this close to its high, and Goldman Sachs estimates that breadth has fallen to its lowest level since the dot-com bubble, with the median S&P 500 stock trading 16% below its 52-week high.[3] Measured by price, RSP relative to the S&P 500 has fallen back to the lowest levels since the fund launched in 2003.
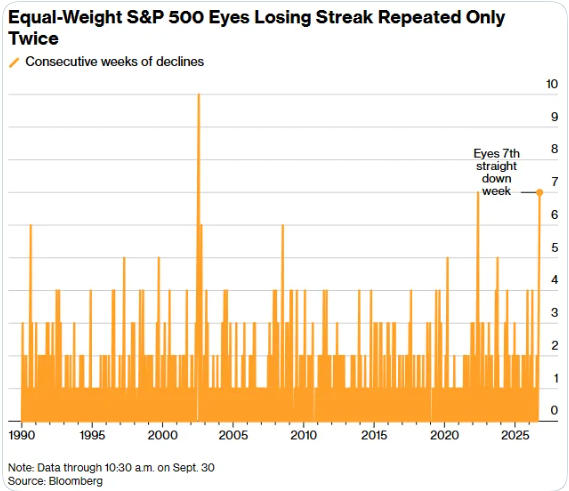
Equal-Weight S&P 500, Consecutive Weekly Declines Since 1990
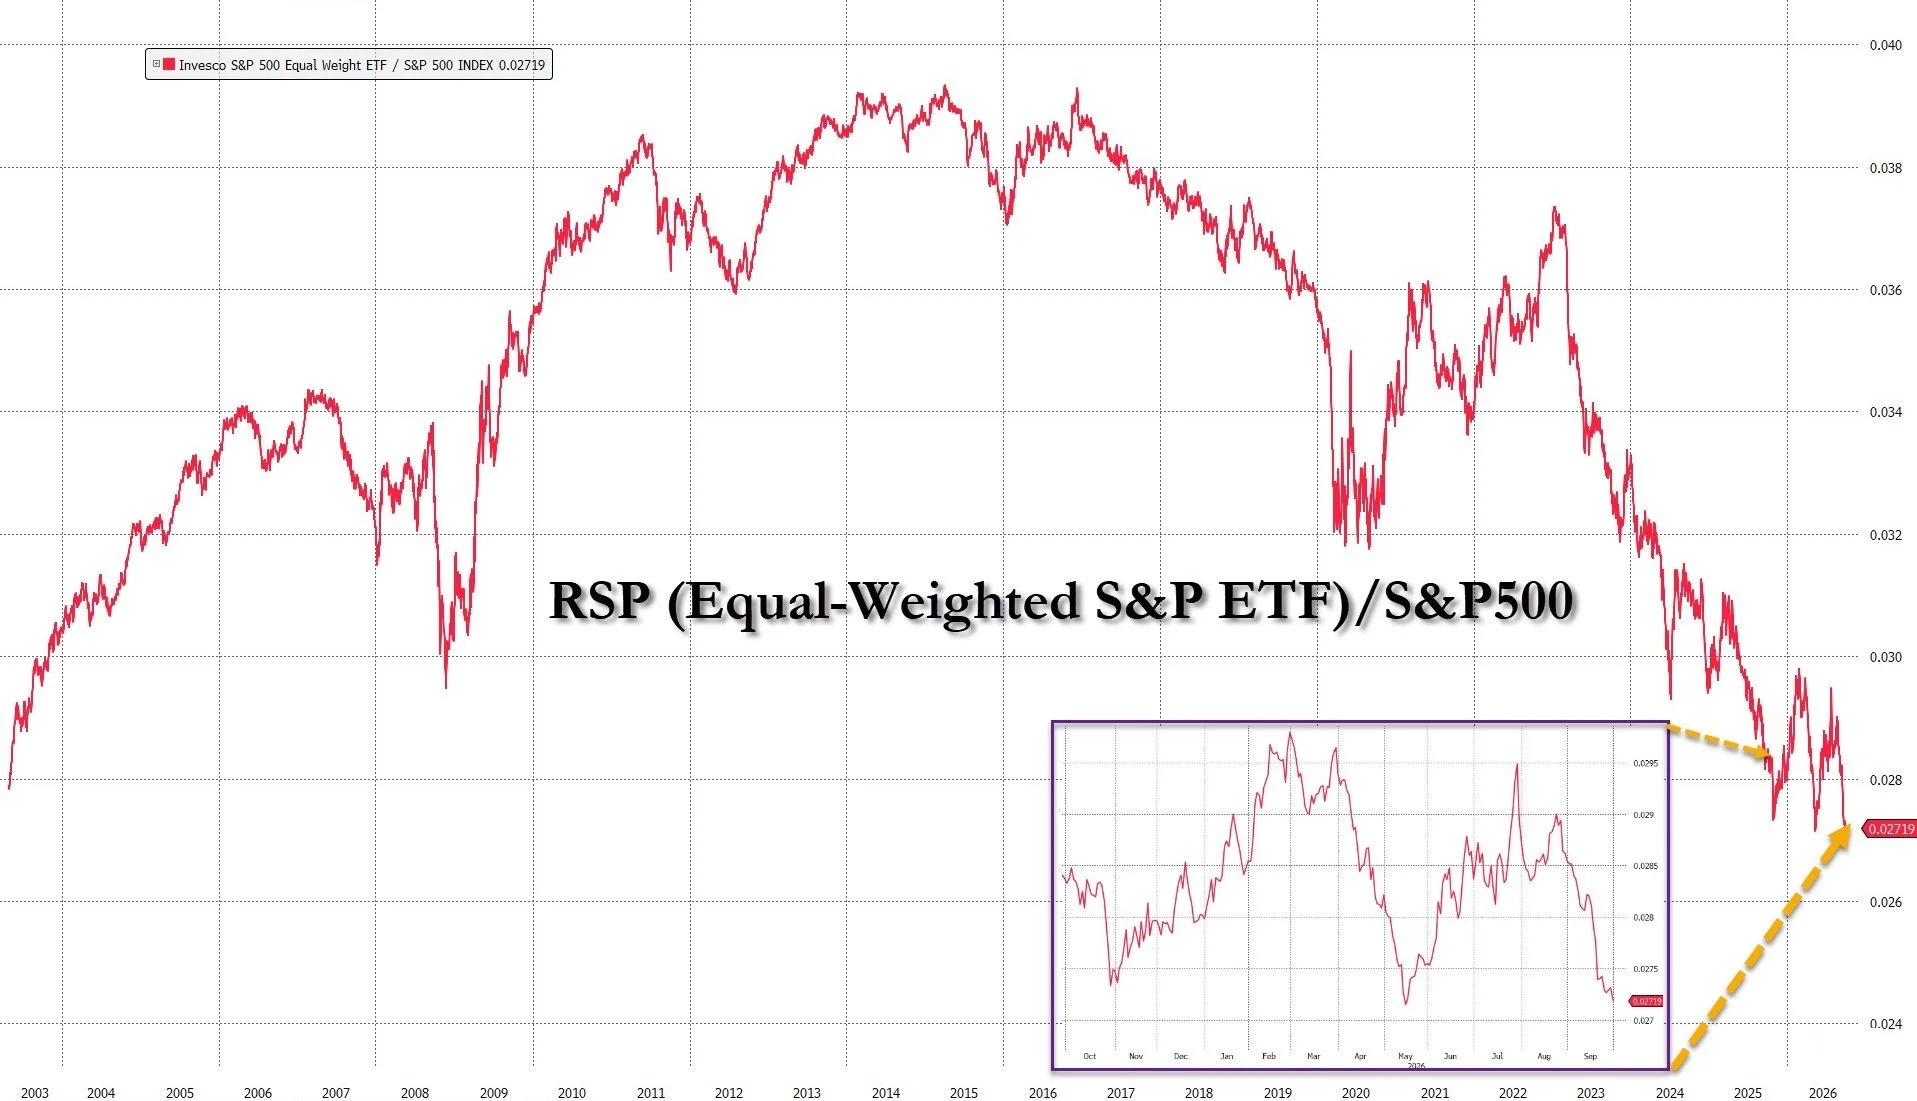
RSP vs. S&P 500 Price Ratio, 2003 to Present (Source: Zero Hedge)
What Narrow Breadth Has Meant Before
History does not say a market this narrow has to fall, but it does say returns tend to get harder to come by. LPL Financial looked at every instance since 1991 when the S&P 500 was within 3% of a 52-week high while fewer than 55% of its members traded above their 200-day moving averages and fewer than 3% were making new highs, conditions much like today's. There were 21 such occurrences, and the index went on to average gains of just 0.4%, 1.7%, 3.8%, and 6.3% over the following one, three, six, and twelve months, with positive outcomes notably less frequent than usual. LPL's conclusion, which we share, is that this is a caution flag rather than a sell signal.[4]
The longer-run pattern points toward an eventual catch-up for the rest of the market, but not on any set schedule. S&P Dow Jones Indices found that equal weight lagged the cap-weighted S&P 500 for more than five years, from August 1994 to February 2000, before beginning a six-year run of superior returns. The turn was abrupt: the worst six-month stretch for equal weight's relative performance ended in February 2000, when it trailed by 10.79%, and the best ended just a year later, in February 2001, when it led by 20.04%.[5] Goldman Sachs makes a similar point today, seeing potential for both broad market upside and a catch-up from recent laggards if macro uncertainty eases.[3]
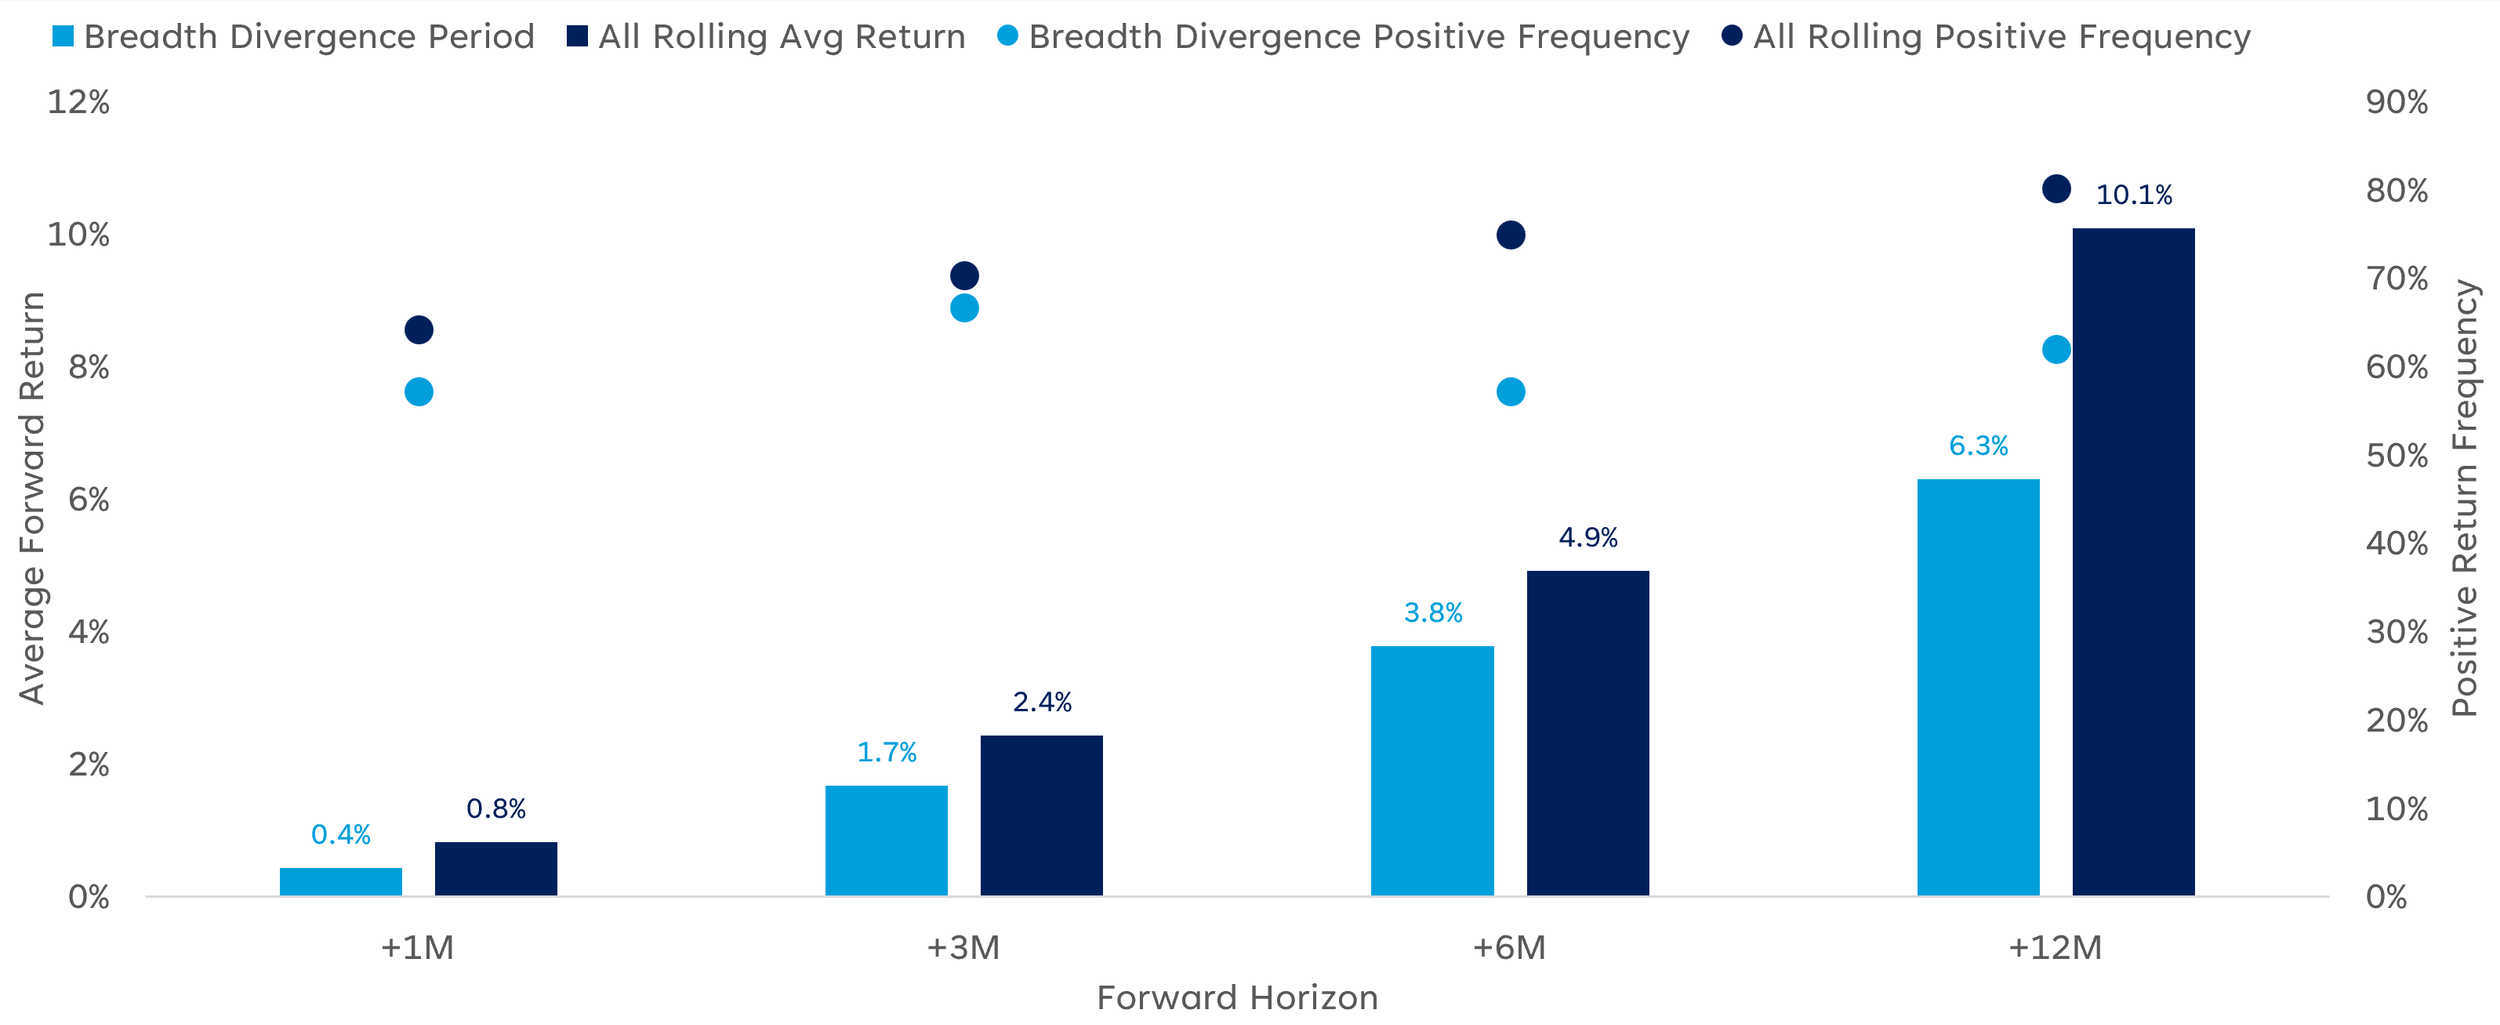
Forward S&P 500 Returns Following Comparable Breadth Divergences (LPL)
Taken together, the evidence argues for discipline rather than prediction. Narrow leadership can last far longer than seems reasonable, and when it breaks, the rotation tends to be fast. We would rather let our signals guide us on both sides of that turn than try to call it.
When Ten Stocks Do the Lifting
Last month we wrote that we would be watching for confirmation that breadth could hold up without an earnings-season catalyst, and that we would rotate if the evidence shifted. It shifted in the first days of September. On 9/3, as our signals on equal-weight and small and mid-cap exposure broke down, we sold RSP and VXF and began a staged move out of that part of the market, which we completed on 9/14 when we swapped out our remaining small-cap position. From the 9/3 close through month-end, RSP fell 5.11% and VXF fell 4.18%, compared with 1.12% for the S&P 500. On the same day we added to S&P 500 Growth (VOOG), and on 9/29 we added Technology (XLK) and National Critical Technologies (CRTC), leaning further into the part of the market that was working.
Even so, the Moderate model returned -2.36% in September, versus -1.23% for the 60/40 benchmark. Getting out of RSP and VXF helped, but the ten largest companies now make up nearly 38% of the S&P 500, and when a handful of them carry the index, owning almost anything else costs you. The table below shows what September looked like across the major building blocks of a diversified portfolio.
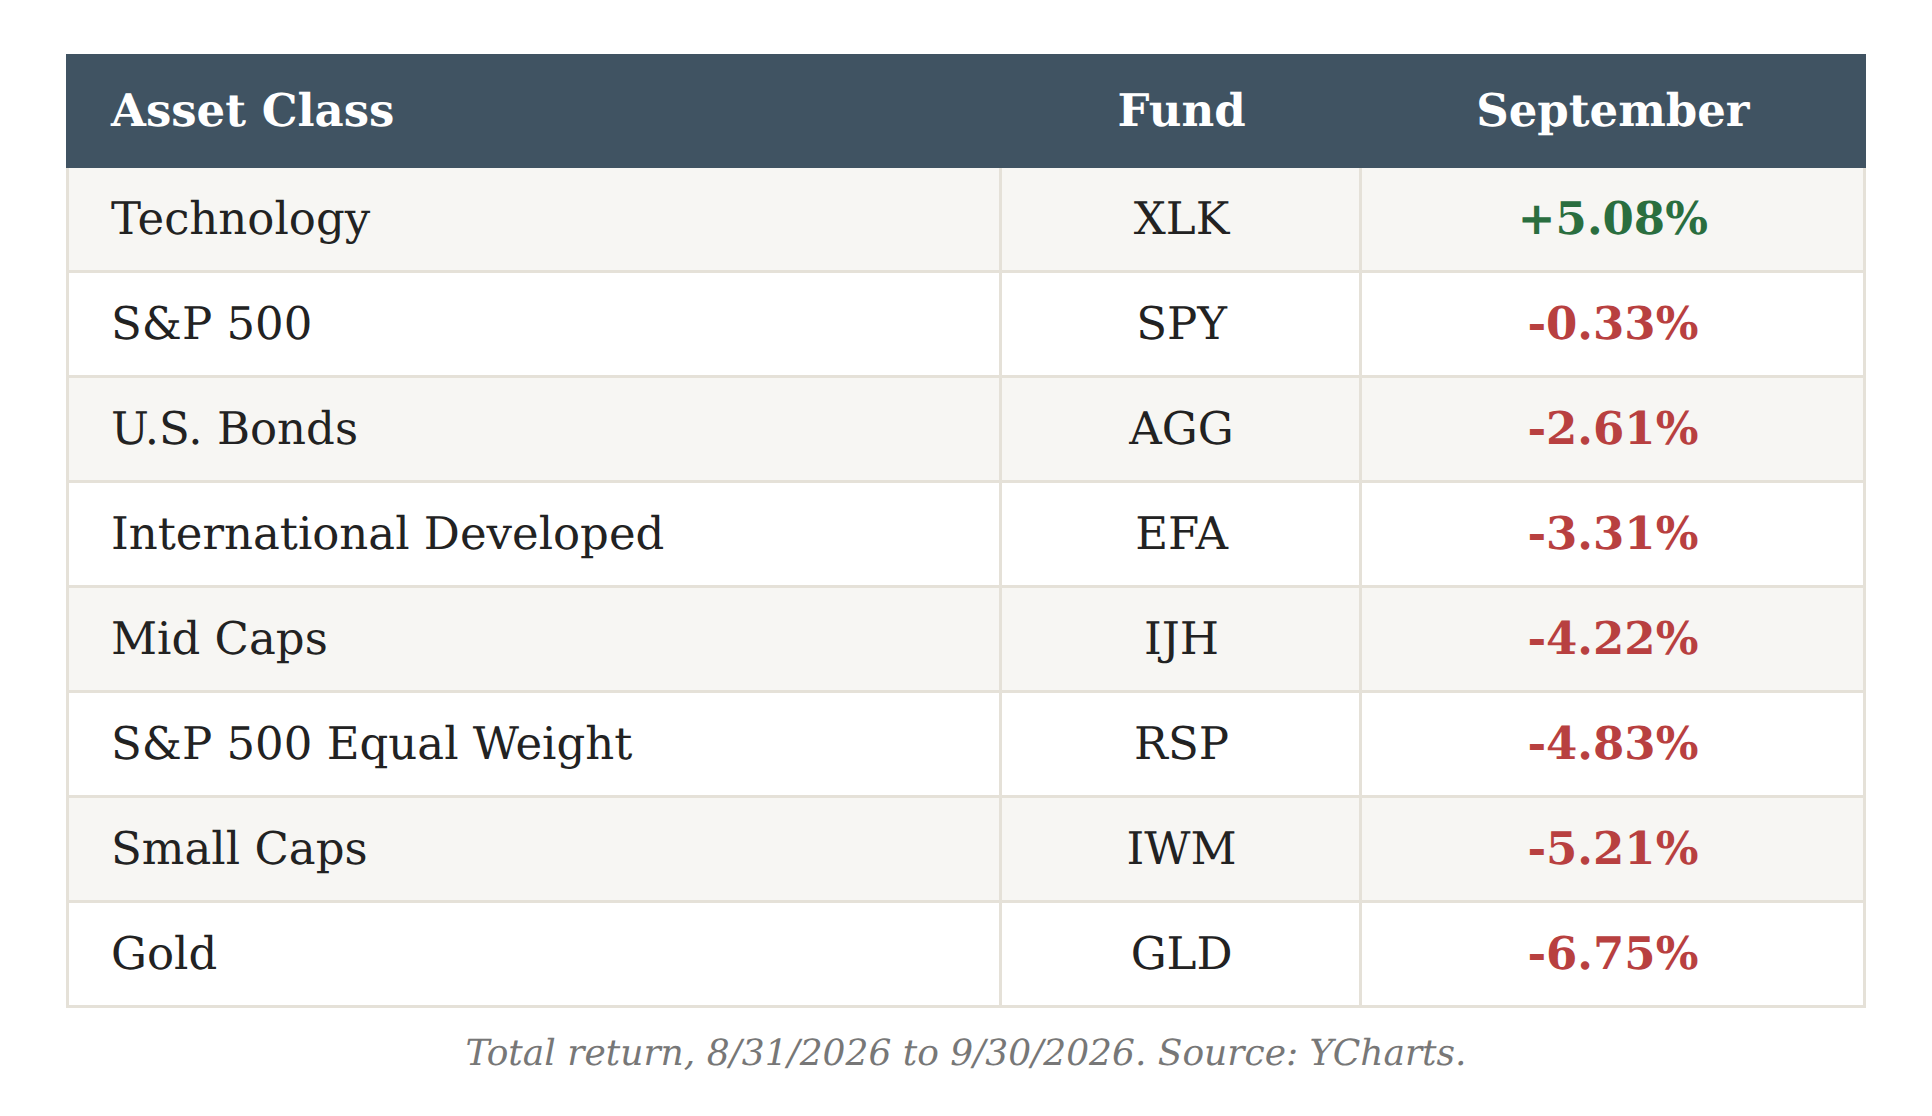
September 2026 Total Returns
Our core equity holdings are built to own the broad market, anchored by a U.S. fund that weights companies by their fundamentals rather than their market size and spread across U.S., international, and emerging market stocks, and the model also holds gold and a full bond allocation. In a normal month, each of those is a sensible diversifier. In September they fell together, while the benchmark's 60% stake in the cap-weighted S&P 500 rode the few stocks that were working. Bonds fell alongside stocks, though our bond holdings held up better than the broad bond index, and gold gave back ground as the dollar strengthened. Outside of technology stocks and oil, which rallied on the Middle East escalation, there was very little place to hide.
That is the uncomfortable trade-off of diversification. When ten names do the lifting, it simply does not pay, at least for a while. It is also what kept the Moderate model ahead of the benchmark for most of this year, and it is designed to help when that leadership finally turns. We are not going to abandon it over one month's result.
Participating, With Caution
For now, technology and the largest companies look likely to keep leading in the months ahead, and we want exposure to that leadership. We hold it through S&P 500 Growth (VOOG), Technology (XLK), Cybersecurity (BUG), and National Critical Technologies (CRTC). At the same time, we are staying cautious, because that leadership has been anything but smooth. Technology stocks, measured by XLK, fell nearly 8% in July, then rebounded about 6% in August and another 5% in September, and individual leaders have moved even more sharply, with Meta alone rising 27% in September.
We will keep working to capture as much of the market's upside as we prudently can, but we want to be direct about the math. If breadth stays this narrow, a diversified portfolio is unlikely to keep pace with an index carried by a handful of technology stocks. Only a portfolio concentrated almost entirely in those names would, and that is not a level of risk we believe is appropriate for our clients.
Earnings are the other reason for caution as we look toward the first quarter of 2027. Consensus estimates via FactSet call for S&P 500 earnings growth of 29.1% in the third quarter of 2026 and 26.8% in the fourth, before slowing to 18.4% in the first quarter of 2027 and just 1.7% in the second, as companies begin to compare against this year's exceptional results.[6] If those estimates hold, the question becomes when the market starts to price in that slowdown. Our goal is to participate in the upside while it lasts, without carrying more risk than we would want to hold when that inflection point arrives.
September was a reminder that a headline number can hide a great deal. We will keep following the data, stay disciplined about risk, and adjust as the evidence changes.
Sources
[2] https://www.bespokepremium.com/morning-lineup/bespokes-morning-lineup-10-1-26-hello-october/
[4] https://www.advisorperspectives.com/commentaries/2026/09/28/message-market-breadth
[5] https://www.indexologyblog.com/2023/07/27/mean-reversion/
Model Performance Update
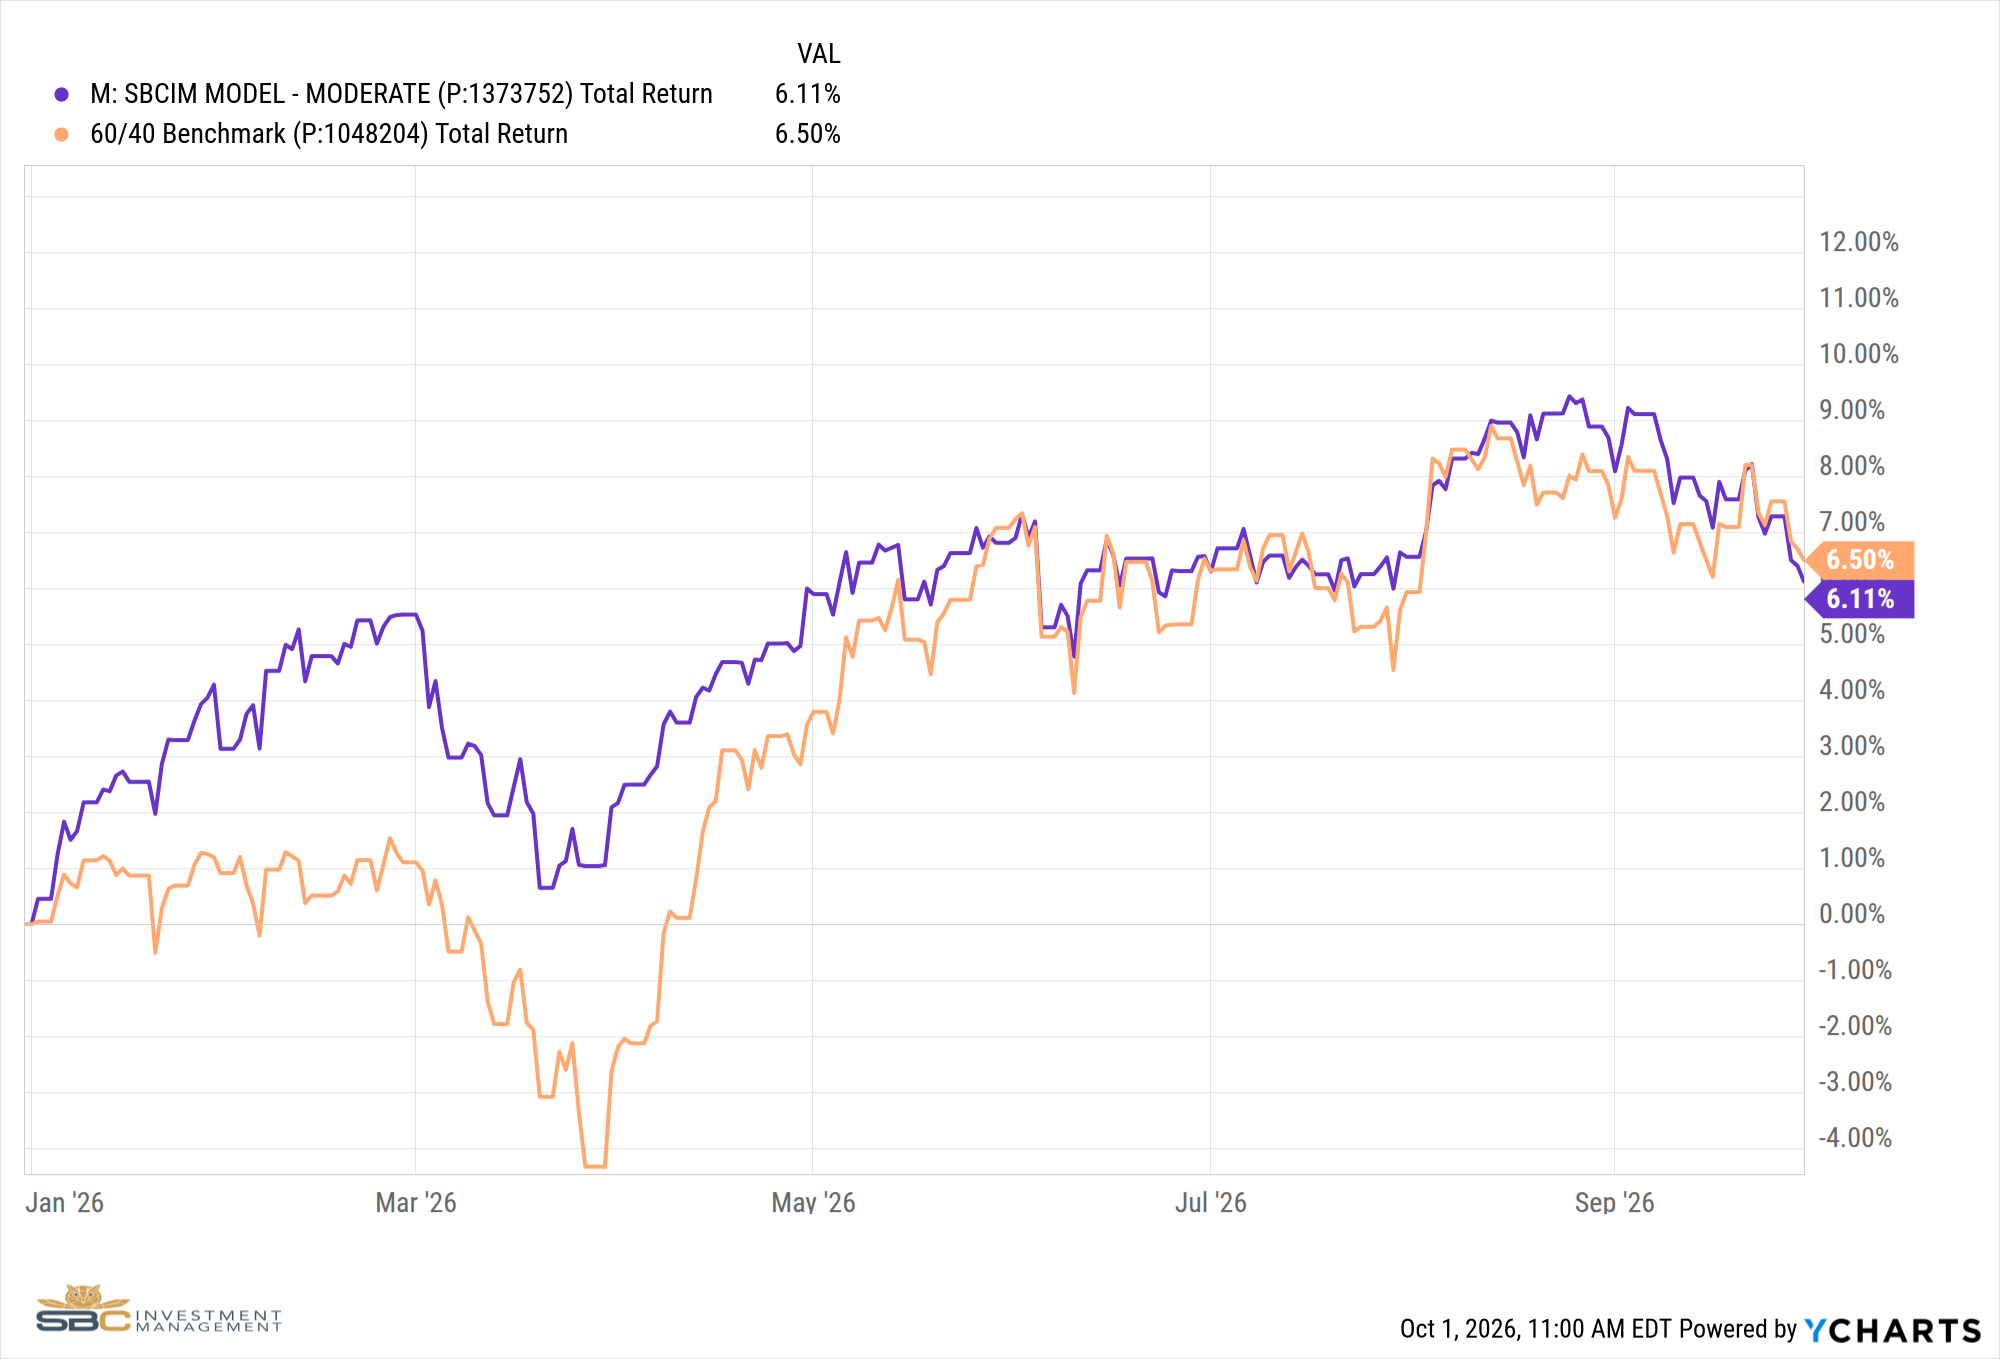
Our Moderate Model Portfolio returned -2.36% in September and has returned 6.11% YTD, versus the 60/40 Benchmark's -1.23% in September and 6.50% YTD.
Portfolio Changes — September 2026
9/3/2026
● Sold RSP (Equal Weight S&P), VXF (Small and Mid Caps), SMDV (Small Cap Dividend), and VYM (High Dividend Equity) in Satellite 1
● Bought XLF (Financials) and IWM (Small Caps) in Satellite 1
● Added to EEM (Emerging Markets), VOOG (S&P Growth), and HDV (High Dividend Equity) in Satellite 1
9/14/2026
● Swapped IWM (Small Caps) for VFLO (Free Cash Flow ETF) in Satellite 1
9/17/2026
● Sold QTUM (Quantum Computing) and XLF (Financials) in Satellite 1
● Added proceeds to FDRXX (Money Market) in Satellite 1
9/28/2026
● Sold EEM (Emerging Markets) and VYMI (International High Dividend) in Satellite 1
● Added proceeds to FDRXX (Money Market) in Satellite 1
9/29/2026
● Bought XLK (Technology) and CRTC (National Critical Technologies) in Satellite 1, funded from FDRXX (Money Market)
● Sold HYG (High Yield Bonds) in Satellite 2
● Added proceeds to TLT (20+ Year Treasuries) and XTEN (10-Year Treasuries) in Satellite 2
September Performance with Benchmark
YTD Performance through September with Benchmark
If you have any questions about the above, please reach out to us to set up a one-to-one meeting so we can review your situation.
Sincerely,
Bryant Andrus, MSF, CFP®
President
SBC Investment Management
P: (602) 641-5996 · M: (319) 520-2033 · E: bandrus@sbcinvestmentmanagement.com
Jake Rehkop
Investment Analyst, Junior Portfolio Manager
SBC Investment Management
P: (435) 775-2950 · M: (435) 590-8317 · E: jrehkop@sbcinvestmentmanagement.com