
Broadening Out
TL;DR
● Q2 earnings season is now complete, and the results confirm what started to take shape over the summer: earnings growth broadened out beyond the handful of mega-cap names that have driven this market since 2023.
● The Magnificent 7 still grew earnings faster than the rest of the index in Q2 (31.1% year over year versus 22.8%), but the trend line matters more than the snapshot: Magnificent 7 growth has come down sharply from an unusually strong 63.2% in Q1, while growth for the other 493 companies has climbed every quarter this year, and consensus estimates via FactSet show the two crossing by Q4 2026.
● That broadening showed up directly in performance, RSP and VXF have both outpaced the S&P 500 year to date and over the trailing three months, but earnings season was very likely the catalyst behind it, and we are watching closely for evidence that breadth can persist now that the catalyst has passed.
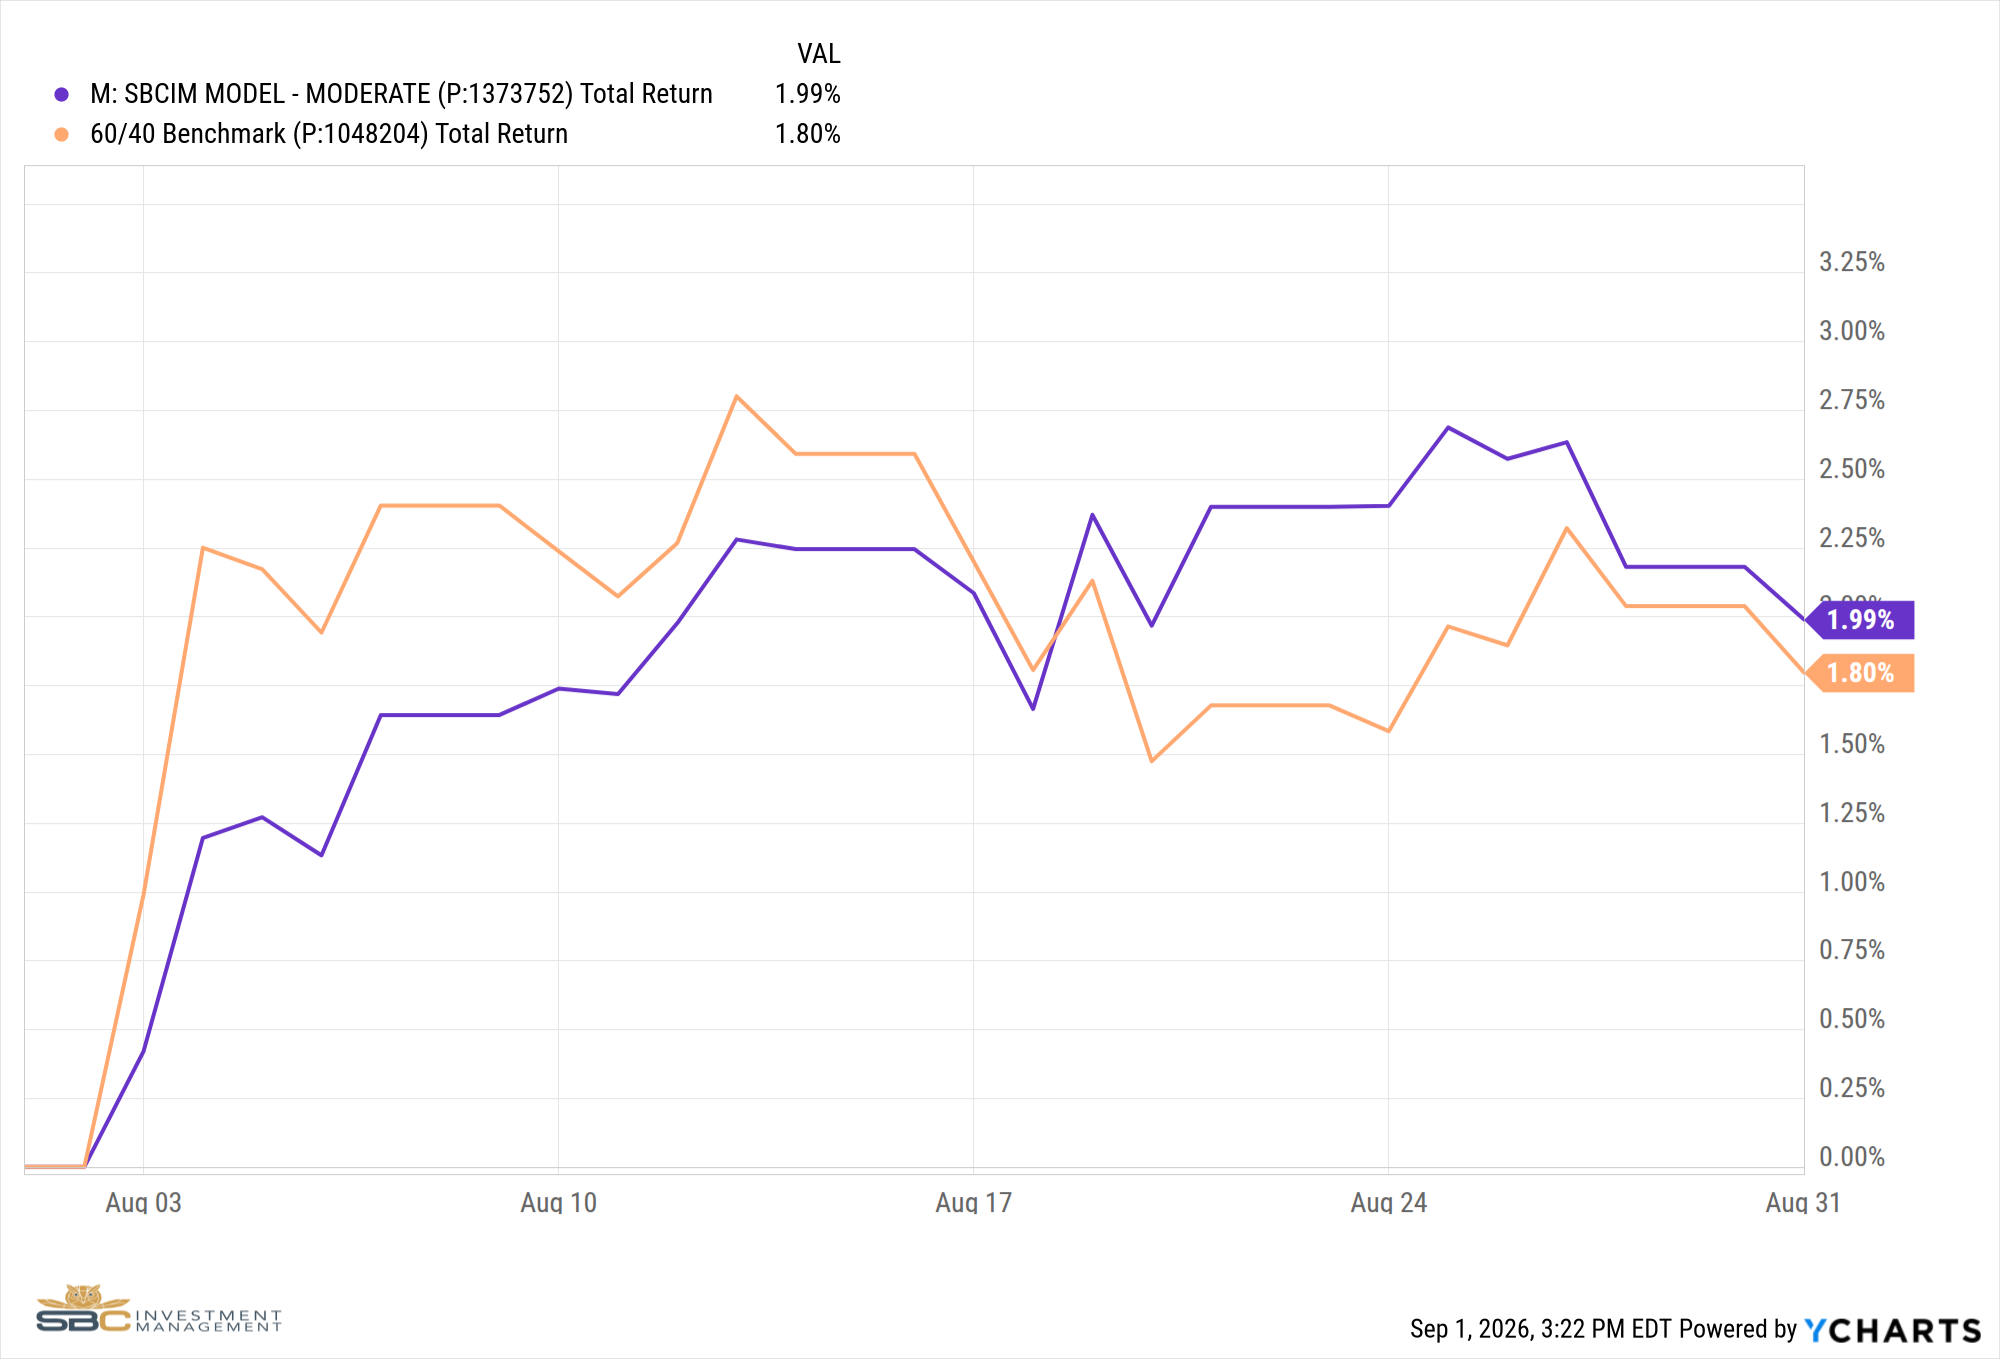
● Our Healthcare positions (FXH, XLV), added mid-June, have returned 14.73% and 13.65% since versus 3.78% for the S&P 500, among our strongest satellite performers of the past three months, and our Moderate model returned 1.99% in August versus the 60/40 benchmark's 1.80%.
● On a monthly basis, Hedgeye's GIP model calls for September as a Quad 1 and stays mostly in Quad 1s and 2s into year end, though a late-August U.S. strike on Iranian targets is a reminder that geopolitics can reprice this market in a single session.
August in Review
Equities pushed to fresh records early in August, with the Dow briefly topping 54,000 and the S&P 500 and Nasdaq notching new all-time highs, as cooler than expected inflation data, July's Consumer Price Index rose just 0.1% month over month and 3.4% year over year, eased pressure on the Federal Reserve.
Nvidia's earnings, reported August 26th, offered a fundamentals-driven story of their own. Management guided to roughly 70% revenue growth for the coming fiscal year, well above the roughly 45% consensus estimate, pushing the company's market capitalization to approximately $5.5 trillion and reinforcing that strong execution is still being rewarded even as the macro backdrop shifts.
That momentum met resistance a day later. At the Jackson Hole Symposium on August 28th, Fed Chair Kevin Warsh delivered a notably hawkish message, citing a 12-month core PCE reading of 3.7% against the Fed's 2% target and declining to offer forward guidance on the path of rates. Markets responded immediately, pricing the odds of a September rate hike up to roughly 52% from around 30% before the speech, and that repricing has continued since, prediction markets on Polymarket now put the odds of a September hike at roughly 60%. Rate-sensitive corners of the market felt it first, the Russell 2000 fell 1.49% that week even as the S&P 500, Nasdaq, and Dow all posted modest gains.
Then, over the final weekend of August, U.S. forces struck Iranian targets on Larak Island, and Iran responded with strikes on a U.S. base in Jordan. When markets reopened Monday, August 31st, oil prices jumped, West Texas Intermediate crude rose more than 2% to above $85 a barrel and Brent crude topped $90, while the Dow fell 359 points (0.7%) and the S&P 500 and Nasdaq each slipped about 0.4%. Even so, all three major indexes held onto their gains for the month, the Dow's fifth consecutive positive month, and the S&P 500 and Nasdaq's first monthly gains since May, up roughly 2% and 3% respectively, with Technology leading the way, up nearly 6% for the month.[4]
Where The Earnings Growth Is Coming From
With Q2 earnings season now behind us, 88% of S&P 500 companies had reported as of early August, and the index's blended earnings grew 50.4% year over year on revenue growth of 15.0%, the strongest revenue growth pace since 2021. Both figures were inflated by unusually large, investment-related gains at Alphabet and Amazon, excluding those two names, blended earnings growth still came in at a robust 32.0%.[1]
The more important number for our broadening thesis is not the Q2 comparison on its own. On an absolute basis, the Magnificent 7 still grew earnings faster than the rest of the index, 31.1% year over year versus 22.8% for the other 493 companies, so a reader looking only at those two figures could reasonably ask what broadening even means here. What matters is the direction each is moving, not the Q2 level.
The Magnificent 7's growth rate has been decelerating from an unusually high starting point: after growing 63.2% year over year in Q1 2026, it fell by roughly half to 31.1% in Q2. Consensus estimates via FactSet call for that pace to hold close to steady at 31.8% in Q3 before falling further to 22.8% by Q4 2026. The other 493 companies are moving in the opposite direction, climbing every quarter so far this year, from 17.9% in Q1 to 22.8% in Q2, with consensus estimates calling for roughly 25.5% in Q3 and a similar 25.3% in Q4.[2] Run both lines forward and they cross: consensus estimates via FactSet already show the other 493 companies overtaking the Magnificent 7 in year-over-year earnings growth by Q4 2026, for the first time this cycle. That crossover, the rate of change in each group's growth rate, not the Q2 snapshot by itself, is the story behind the broadening we are describing.
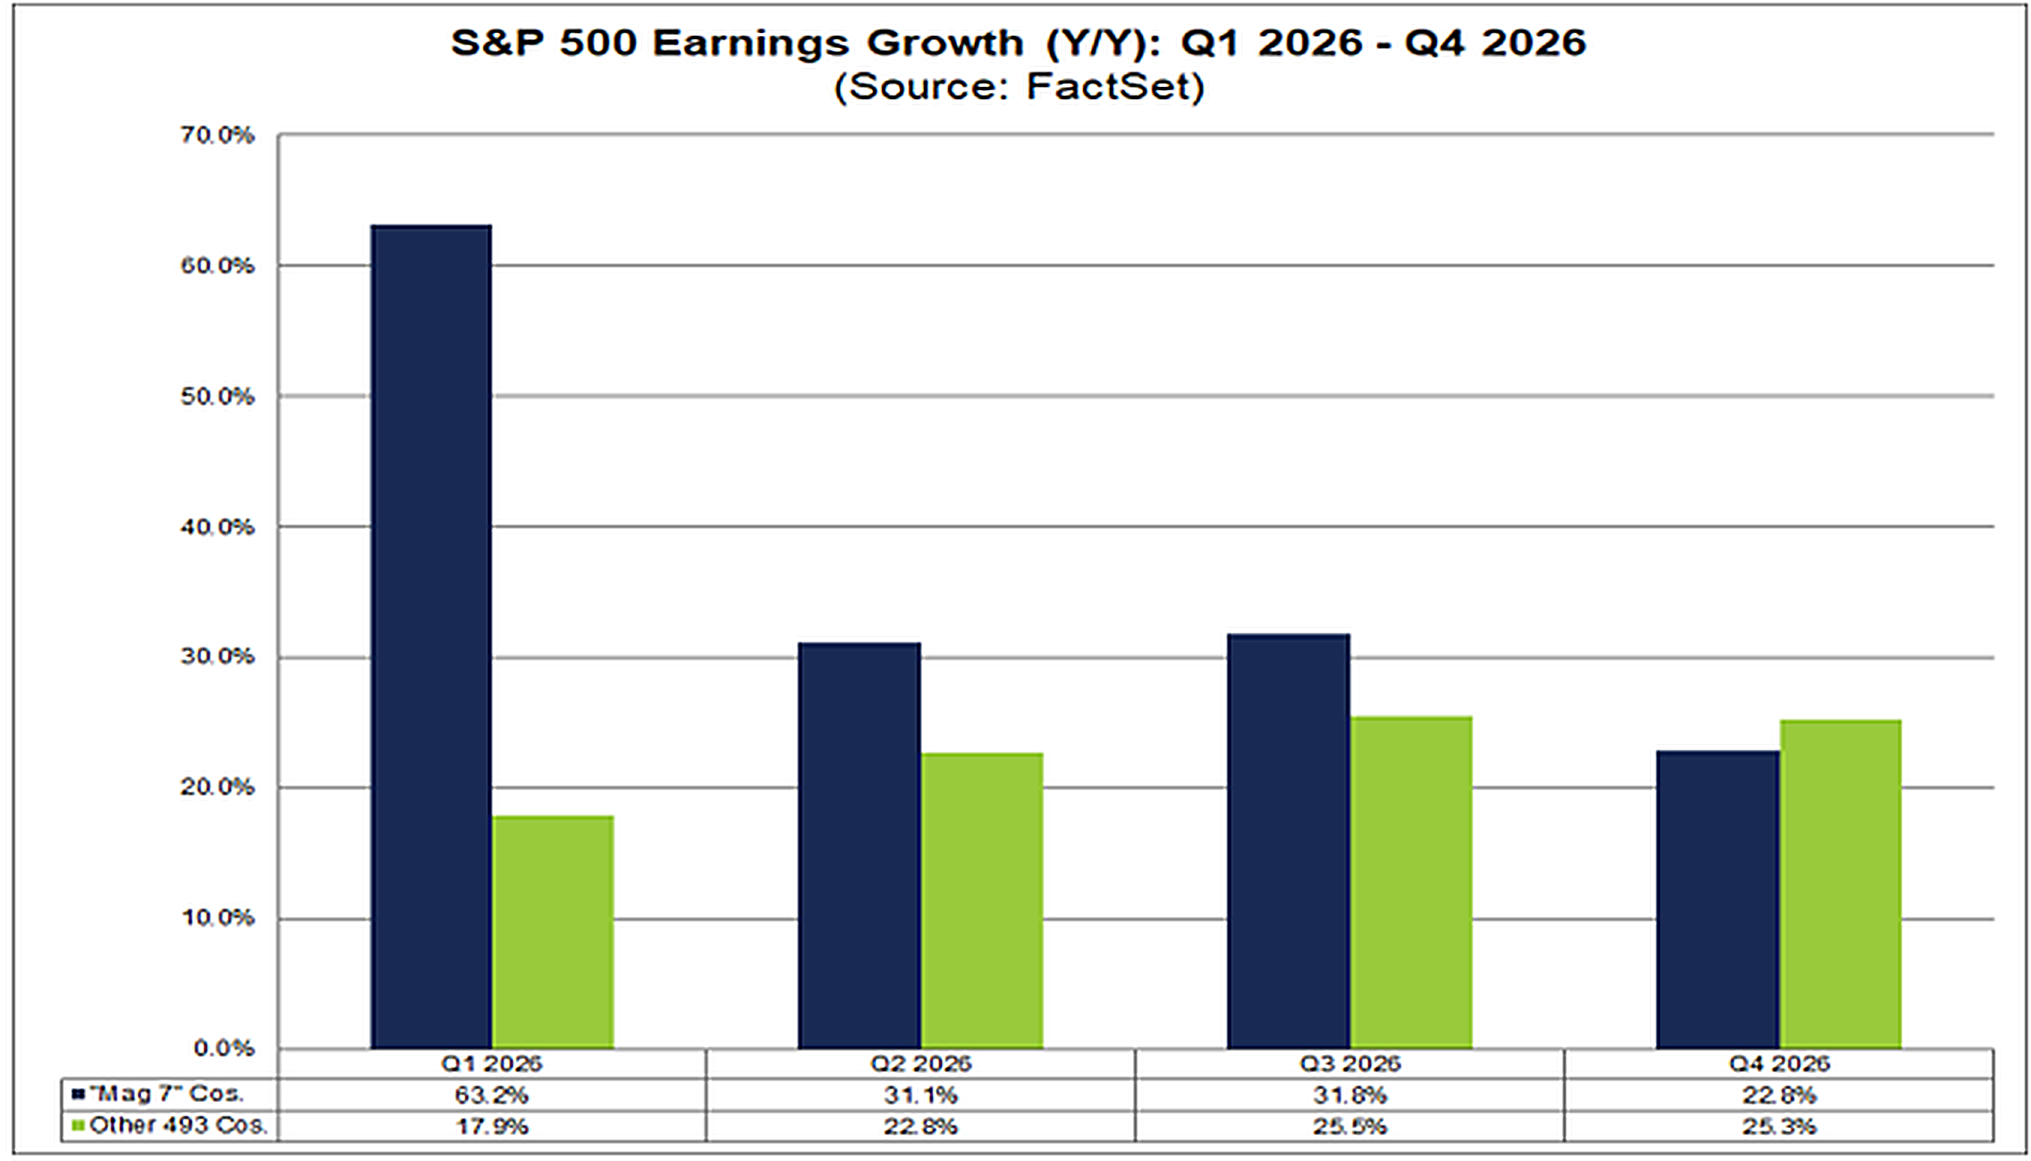
Magnificent 7 vs. Other 493, Y/Y Earnings Growth: Q1–Q4 2026
That broadening shows up directly in how the market has traded. Both RSP, the equal-weight version of the S&P 500, and VXF, which holds the mid and small-cap names outside the S&P 500, have outperformed the cap-weighted index both year to date and over the trailing three months. Through the start of September, RSP is up 15.46% year to date versus 13.14% for the S&P 500, and VXF is up 16.08%. Over the trailing three months, RSP has returned 5.46% and VXF 2.36%, versus 1.68% for the S&P 500.
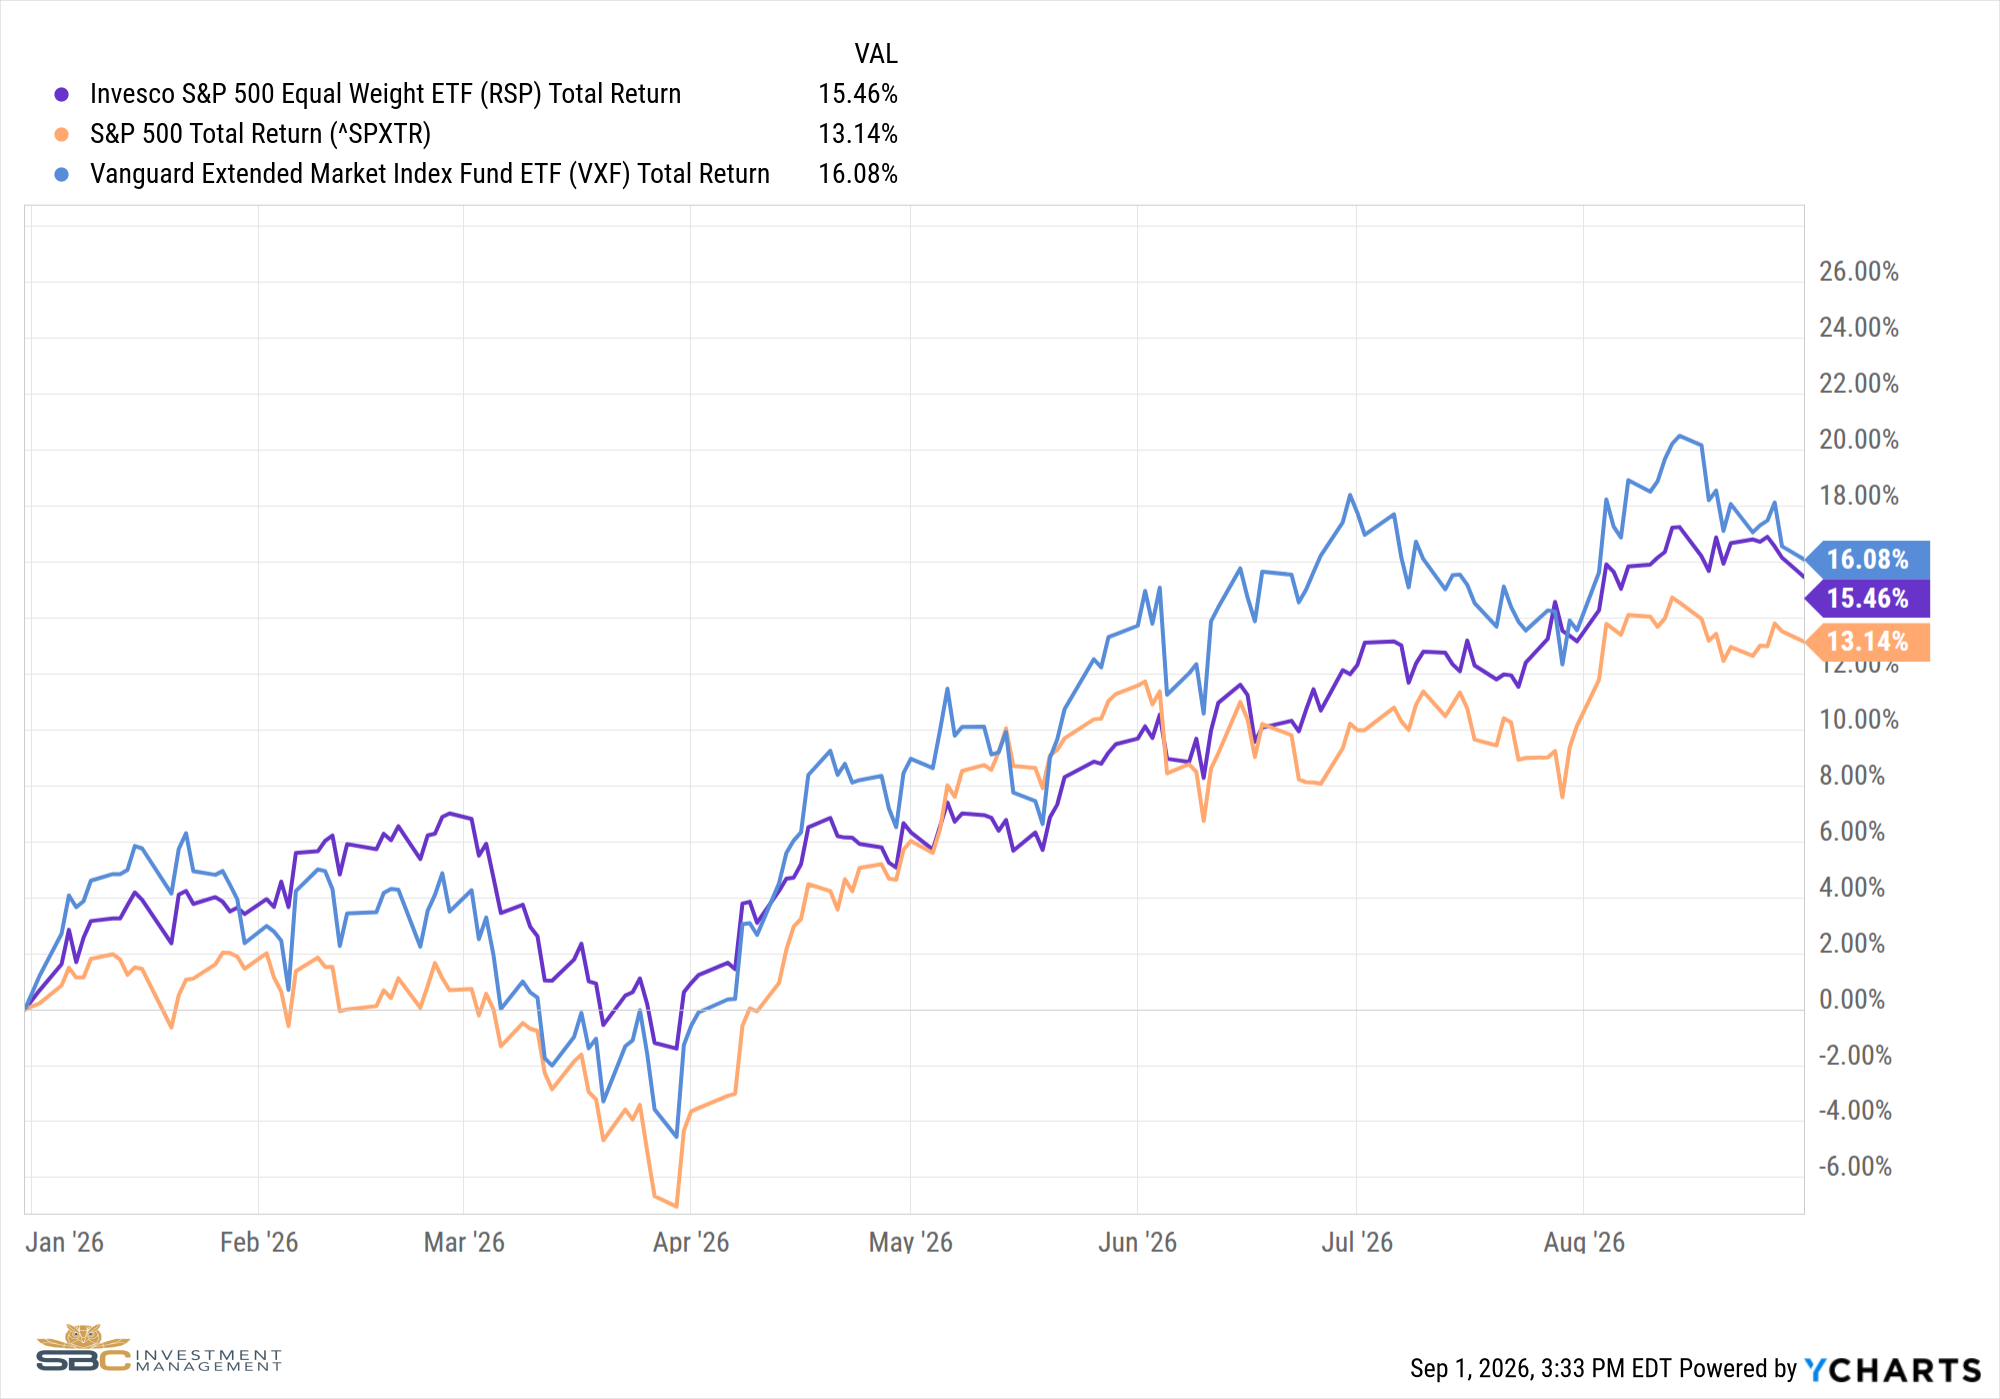
RSP vs. S&P 500 vs. VXF, Year to Date
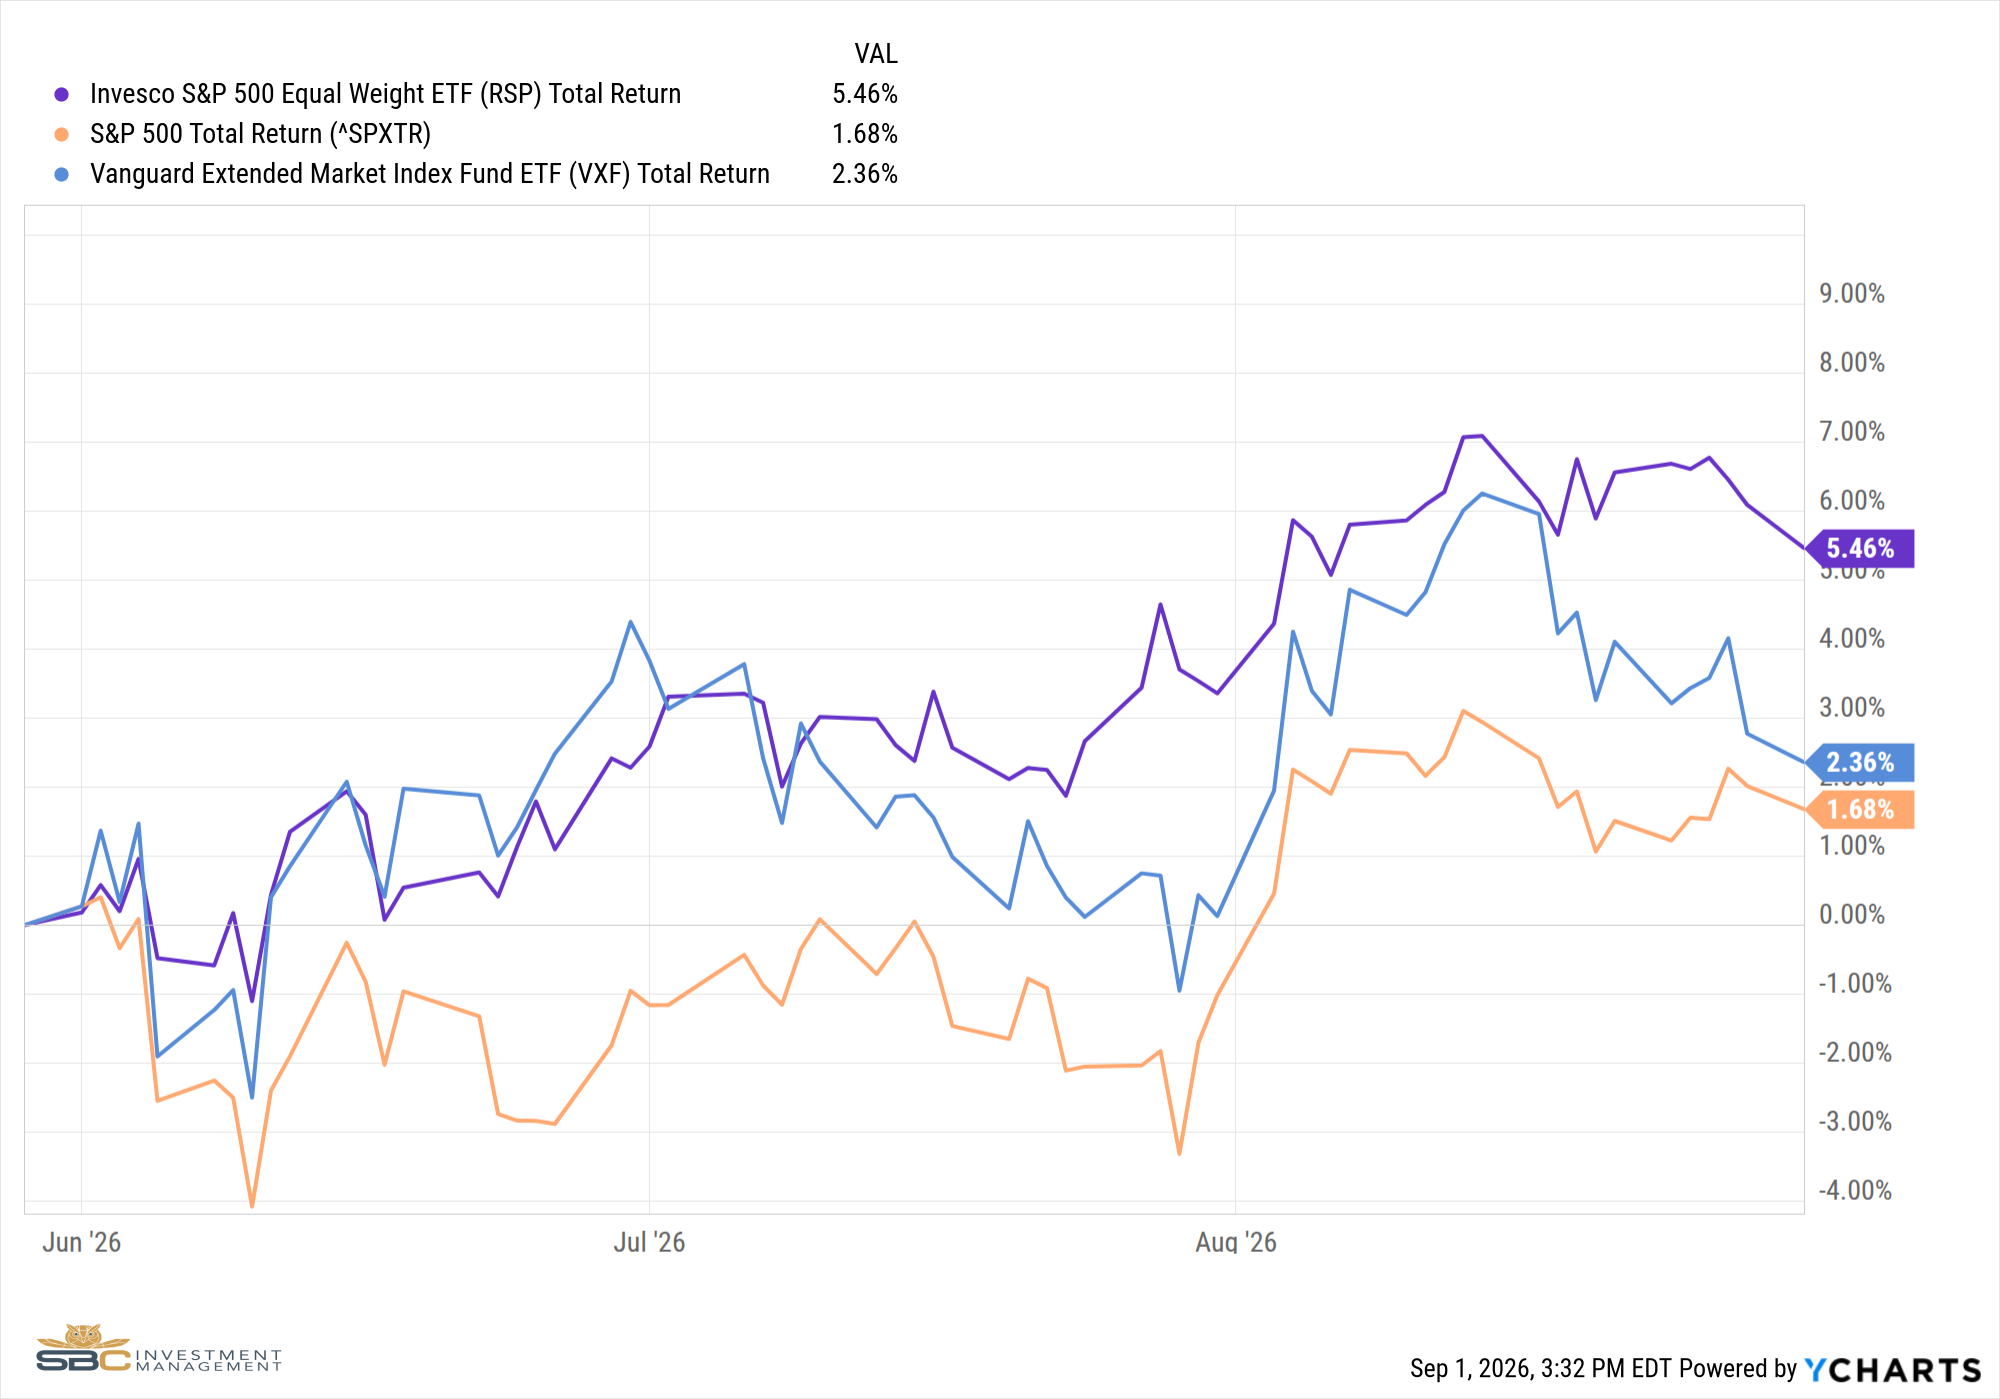
RSP vs. S&P 500 vs. VXF, Trailing Three Months
Breadth showed up in some less obvious places too. Our Healthcare positions, FXH (First Trust Health Care Fund) and XLV (Health Care Select Sector SPDR), added to the satellite portfolio in mid-June as part of our defensive shift ahead of the summer's volatility, have been two of the market's quieter winners of the past three months. Since mid-June, FXH has returned 14.73% and XLV 13.65%, against 3.78% for the S&P 500 over the same stretch, with the broader S&P Health Care sector gaining 6.16% in July alone even as Technology fell 8%.[3] The fundamentals back up the price action: 96% of Health Care companies beat revenue estimates in Q2, the highest share of any S&P 500 sector and well ahead of the index's 76% overall.[1] It is a useful reminder that this year's broadening has not been limited to the names getting the headlines.
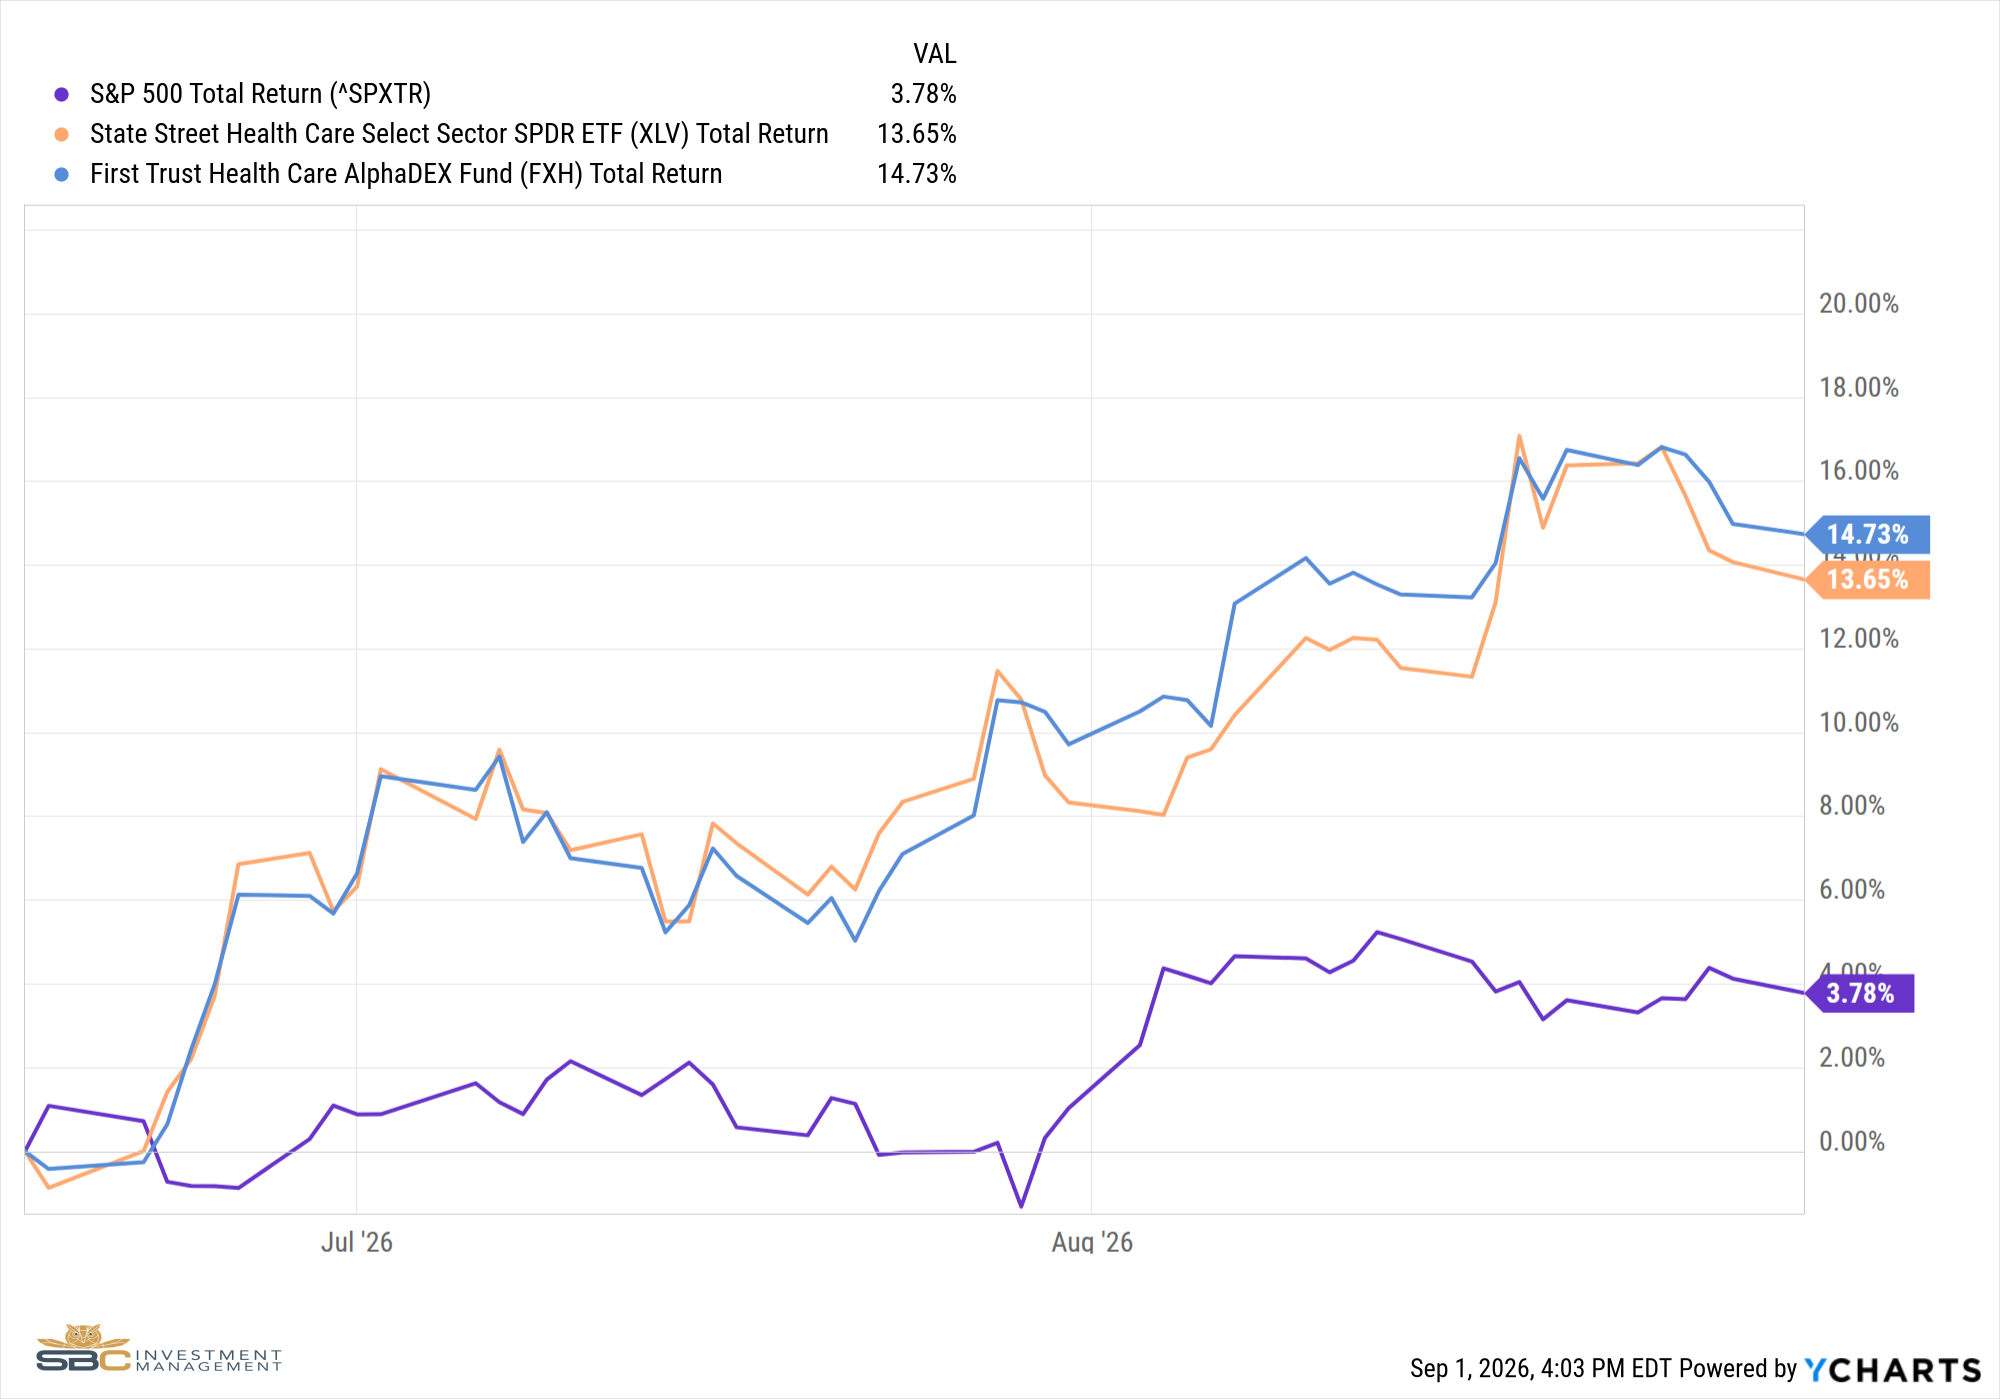
Healthcare (FXH, XLV) vs. S&P 500 Since Mid-June
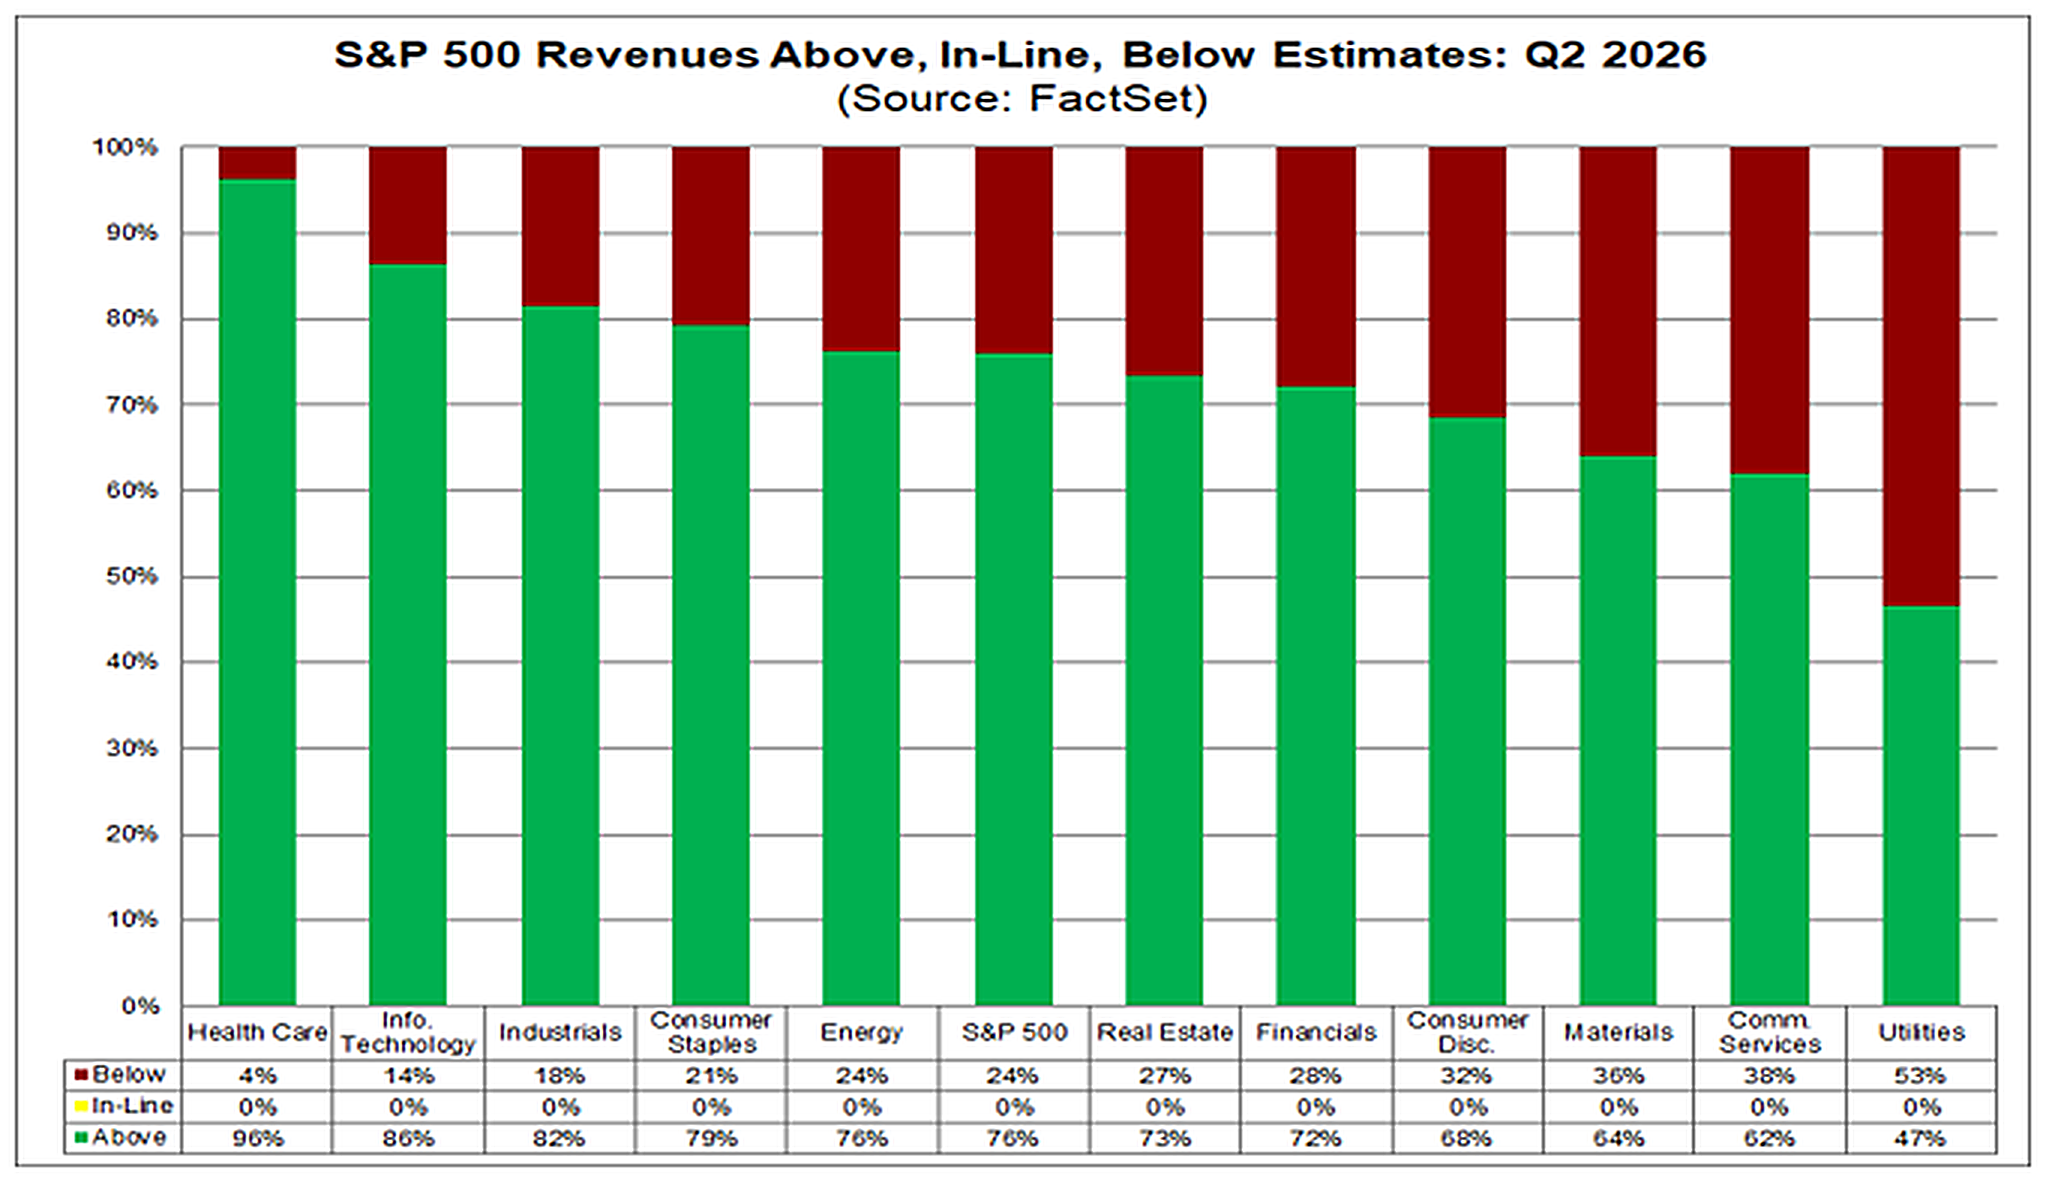
S&P 500 Revenues Above/Below Estimates by Sector, Q2 2026
We want to be precise about what is driving this. Earnings season itself was very likely a significant part of the catalyst behind the breadth we saw this summer, and that season has now closed. We think the data makes a solid case for broadening to continue, and we are comfortable holding RSP and VXF while the evidence keeps supporting it. That said, we are watching September and October closely for confirmation that breadth persists on its own, without a fresh earnings-season catalyst behind it, and if that evidence shifts, we will not hesitate to rotate into whatever the next opportunity turns out to be. Staying disciplined about why a position is working is as important to us as the position itself.
A Signal Building In Gold
Gold is the other position worth calling out. We added Gold Miners (GDX) in Satellite 3 in August, and the signal behind that position has continued to improve. The U.S. Dollar Index fell to its lowest level since mid-May in late August, and gold's 30-day correlation to the dollar sits at roughly -0.79, so a weakening dollar has been a direct tailwind, physical gold gained more than 13% on the month at one point, with silver and gold futures both pushing to fresh highs. That setup depends on the dollar continuing to weaken, though, and it is worth being explicit about the risk to it: a further escalation in the Middle East could just as easily send capital back into the dollar as a safe haven, or push oil and inflation expectations high enough to change the rate path entirely. We like the gold signal as it stands today, but we are watching it, not assuming it holds.
Quads Ahead, And What Could Change Them
On a monthly basis, Hedgeye's GIP model has August printing as a Quad 3 and September as a Quad 1, with the forecast staying constructive into year end: Quad 2 in October, Quad 1 again in November, and Quad 2 in December and January. That is a continuation of the transition we wrote about in July and August, growth deceleration giving way to a stretch of quads that have historically favored equities and a broader opportunity set than the last two years.
The two things that could change that view have not gone away. Semiconductor volatility remains something we watch closely after July's correction, and the geopolitical situation in the Middle East can clearly still move markets in a single session, as the U.S.-Iran exchange over the final weekend of August demonstrated. Neither is a reason to abandon the broadening thesis the earnings data supports, but both are reasons we continue to size new positions like GDX deliberately rather than aggressively.
We remain focused on process over prediction. The Quad framework, the earnings data, and our own positioning are all pointing in a similar direction as we head into the fall, and we will have more to say on how that plays out, and on how the labor market and Fed policy evolve from here, in next month's letter.
Sources
[1] https://insight.factset.com/sp-500-earnings-season-update-august-7-2026
[3] https://www.spglobal.com/spdji/en/documents/performance-reports/dashboard-us-sector.pdf
[4] https://finance.yahoo.com/markets/stocks/articles/dow-falls-360-points-u-193321904.html
Model Performance Update
Our Moderate Model Portfolio returned 1.99% in August and has returned 8.68% YTD, versus the 60/40 Benchmark's 1.80% in August and 7.83% YTD.
Portfolio Changes — August 2026
8/3/2026
● Sold XLU (Utilities) and bought more XLRE (Real Estate) in Satellite 1
8/7/2026
● Added HDV (High Dividend Equity) in Satellite 1
8/14/2026
● Removed IAK (Insurance) and reduced XLV (Healthcare) in Satellite 1
● Added SMDV (Small Cap Dividend) and added to VXF (Small and Mid Caps) in Satellite 1
● Added GDX (Gold Miners) in Satellite 3
8/24/2026
● Sold all CTA (Managed Futures) in Satellite 5
● Initiated a position in HYG (High Yield Bonds) in Satellite 2
● Initiated a position in QTUM (Quantum Computing) in Satellite 1
August Performance with Benchmark
YTD Performance through August with Benchmark

If you have any questions about the above, please reach out to us to set up a one-to-one meeting so we can review your situation.
Sincerely,
Bryant Andrus, MSF, CFP®
President
SBC Investment Management
P: (602) 641-5996 · M: (319) 520-2033 · E: bandrus@sbcinvestmentmanagement.com
Jake Rehkop
Investment Analyst, Junior Portfolio Manager
SBC Investment Management
P: (435) 775-2950 · M: (435) 590-8317 · E: jrehkop@sbcinvestmentmanagement.com