
Market Summary – First Half 2023
Market Summary – First Half 2023
Key Points
1. Bond volatility picked up during the first half of 2023 with all bond categories posting positive returns. The Fed increased rates by 125 basis points bringing the total amount of 2022 rate hikes to 425 basis points. The inversion spread of the 10YR – 2YR Treasury yield curve reached a low of -0.84%. Rates at the long end of the curve rallied pushing the spread up to -0.56% at yearend. The Fed forward futures curve forecasts another 25 to 50 basis points in rate hikes.
2. The stock indexes benefited from a bear market rally with a high degree of variability. given leadership within the indexes was extremely narrow. More than 90% of the total return of the S&P 500 came from seven stocks—Apple, Microsoft, Google, Amazon, Meta, Nvdia, and Tesla. rolled over in December as investors grew more uncertain about the earnings outlook for 2023 and the potential for contagion from the collapse of the FTX cryptocurrency exchange. International stocks rallied from oversold levels and outperformed U.S. stocks. Despite selling off in December, stocks posted their first positive quarter in 2022.
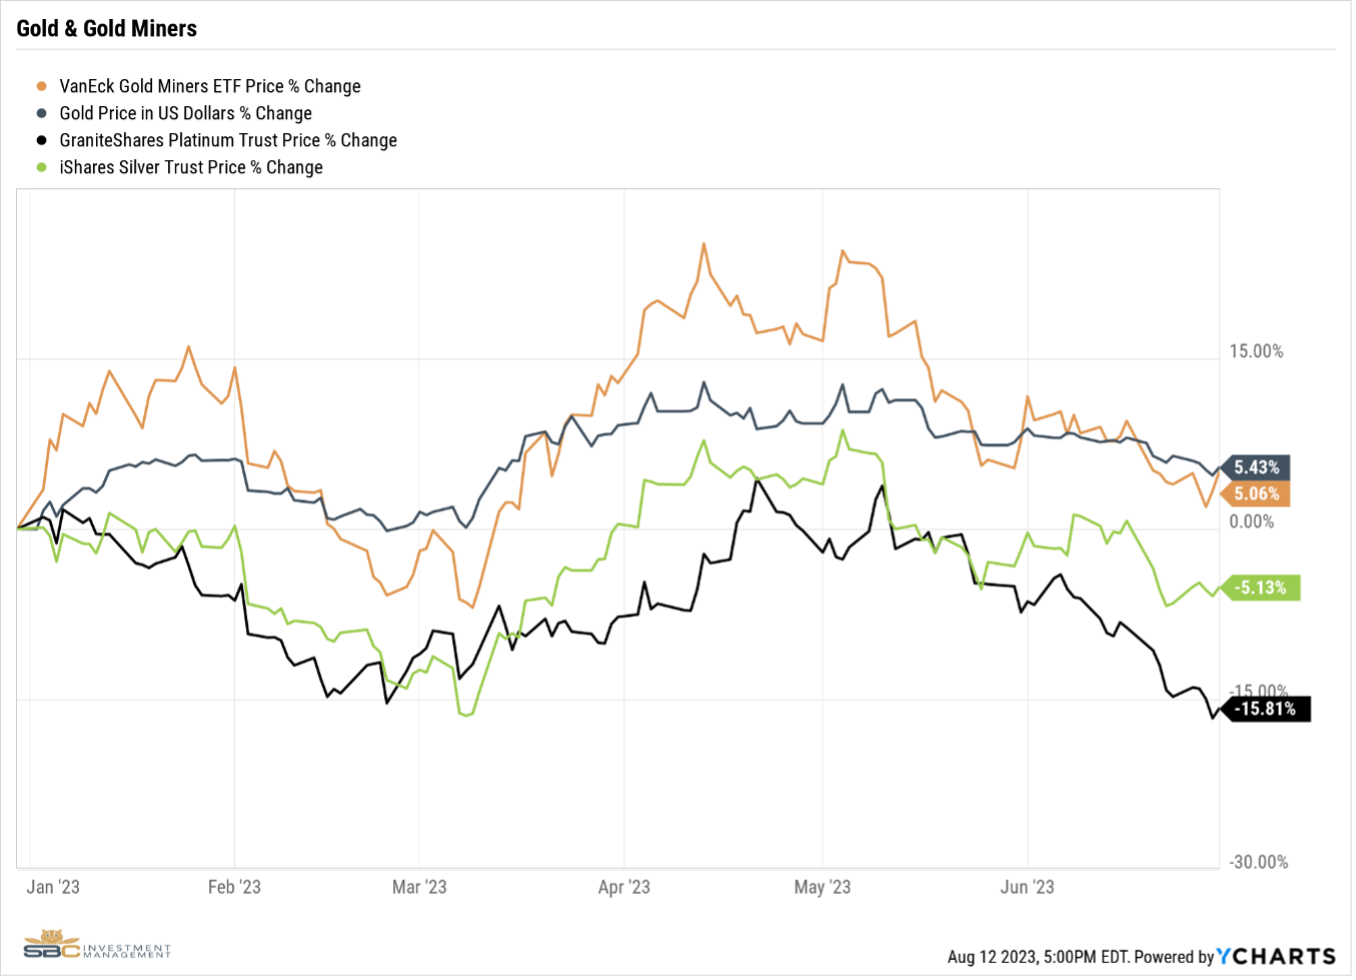
3. The U.S. dollar was down during the quarter which gave a nice lift to gold and other currencies. Gold also benefited from strong Central Bank buying. Commodities rose during the quarter once China intimated the end of its Zero Covid policy.
4. Inflation for December, as measured by the year/year returns in CPI, dropped to 6.5%. Gasoline and used car prices continued to decline month/month. More components of the CPI stopped disinflating and started deflating in December.
5. Mortgages rates reached a 20-year high—climbing to over 7% in October—before dropping into the 6% range. Existing home sales declined during the quarter. Although homebuilders were wheeling and dealing to sell their inventory, cancellation rates jumped. National home prices, as measured by the Case-Shiller U.S. National Home Price Index, declined further. The index was down 3.6% in five months through November.
Market Summary
Stocks continued their roller coaster ride ending this quarter on the plus side. While lower inflation, a weaker U.S. dollar, and expectations for a smaller December rate hike helped push U.S. stocks higher, the bears regained control at the end of November. The fallout from the collapse of FTX began to spread to non-cryptocurrency entities raising concerns of contagion. Public companies began warning of lower fourth quarter profits as consumer spending abruptly slowed and costs continued to rise. CEO confidence reached a low not seen since the financial crisis with most anticipating an economic recession.
The unemployment rate stubbornly low prompting Fed Chairman Powell to remain hawkish, despite growing signs of recession. The 10s/2s yield curve inversion deepened during the quarter. The ISM Manufacturing PMI declined further into contraction territory. Both consumer and commercial loan delinquencies rose. Existing home sales and median home prices remained in a downtrend. Leading economic indicators, as measured by the Leading Economic Index (LEI), declined at a steeper rate. While the Fed’s rate hikes dropped to 50 basis points in December, the magnitude of its quantitative tightening (QT) remained on track.
Bonds finally caught a bid during the quarter as investors moved in to capture some better yields. Global bonds staged an oversold rally besting their U.S. brethren. Despite shrinking liquidity and widening corporate credit spreads, U.S. high yield bonds outperformed less risky bonds.
For the first six months of 2023, the Corporate High Yield index returned 5.38%, the Bloomberg Municipal Bond Index returned 2.67%, the U.S. Aggregate Bond Index increased 2.09%, and the Treasury index returned 1.59%, the International Bond index increased 0.83%.

The Fed’s rate hikes hit bonds hard in 2022 with the U.S. Aggregate Bond Index down 13.01% for the year. The Bloomberg Municipal Bond Index returned -8.93%, the U.S. Corporate High Yield Index returned -11.19%, the U.S. Treasury index returned -12.26%, and the International Bond Index returned -18.70%.

For the first six months of 2023, the Nasdaq returned 32.32%, the S&P 500 returned 16.89%, the Russell 3000 returned 16.17%, the MSCI EAFE returned 12.13%, and the Dow Jones Industrial Average returned 4.93%.

While stocks appeared to be resilient in the face of multiple bank failures and a contentious debt ceiling debate, we see a fair amount of variability amongst the indexes and within the indexes. The Dow Jones Industrial Average was flat for the first five months before seeing an uptick in June, while the Nasdaq pushed ever higher on the backs of its top seven stocks--
All of the major equity indexes were down in 2022 with the more value-oriented indexes performing better. The Dow Jones Industrial Average returned -6.86%, the MSCI EAFE returned -14.01%, the S&P 500 returned -18.11%, the Russell 3000 returned -19.21%, and the Nasdaq returned -32.54%.

All sectors were in positive territory during the fourth quarter, except Consumer Discretionary. Two big heavy weights in Consumer Discretionary—Amazon and Tesla—had abysmal quarters as economic data continued to show a weaker consumer. Performance was interestingly stratified. The more value-oriented Old Economy sectors outperformed significantly. Growth-oriented sectors, and those negatively impacted by higher rates, were at the bottom of the list. This barbell in performance indicates that institutional investors were most likely engaged in some yearend rebalancing.
Value vs. Growth. Value markedly outperformed Growth during the quarter. Growth stocks were hit hard after third quarter GDP came in at 2.6%. With the Fed pivot off the table, Growth was unable to recapture its earlier gains. The Russell 3000 Value Index returned 12.18% versus 2.31% for the Russell 3000 Growth Index.

Value outperformed Growth by a whopping 2,100 basis points in 2022. Higher interest rates and a slowing economy weighed significantly on the lofty valuations of growth stocks. The Russell 3000 Value Index returned -7.98% versus -28.97% for the Russell 3000 Growth Index.

Large Cap vs Small Cap. Small and large cap stocks continued to track each other closely during the fourth quarter with large cap gaining the lead in December. The Russell 1000 Index returned 7.24% and the Russell 2000 Index returned 6.23%.

The sell-off in equities during 2022 was relatively indiscriminate between small and large cap stocks with the large caps pulling off a slight win. The Russell 1000 Index returned -19.13% and the Russell 2000 Index returned -20.44%.

Gold rose during the fourth quarter. A weaker U.S. dollar and strong buying by global Central Banks helped raise gold from the doldrums. Gold miners got a nice lift on higher gold prices which are correlated with dividend increases. Gold prices rose 8.49% to $1,823.91 t.oz. The gold miners were up 18.82%.
Gold struggled against a strong U.S. dollar for most of 2022, while gold miners ended the year flat. Gold prices fell 10.52%, and the gold miners were up 0.44%.

Commodity prices were up during the quarter. Industrial metals pulled ahead of the group as the protests in China began. With social instability being Xi’s greatest concern, investors correctly anticipated an official ending of China’s Zero Covid policy. Food-related commodities continued to trend higher due to higher input costs. Energy posted modest gains.
For the fourth quarter of 2022, the Dow Jones Commodity Index returned 6.16%. Within the index, Industrial metals returned 13.91%, Livestock returned 8.10%, Grains returned 2.72%, and Energy returned 2.36%

While the Dow Jones Commodity Index returned 20.63% in 2022, performance of the commodities complex was a mixed bag. Livestock traded sideways for the year. The other commodities jumped following the start of the Ukraine/Russia conflict. Industrial metals immediately rolled over and trended down with global production. Energy rallied strong before giving up about half of its gains following the sale of U.S. strategic petroleum reserves. Grains followed Energy.
Energy was the best performer for 2022 returning 44.15%. Grains returned 23.03%, Livestock returned 4.92%, and Industrial Metals returned -5.21%.

Most of the major cryptocurrencies were down during the fourth quarter on the heels of the FTX collapse. Only Dogecoin and Litecoin posted positive returns. Dogecoin popped after Elon Musk acquired Twitter, then subsequently declined on the FTX news. Litecoin realized relatively strong demand after FTX filed for Chapter 11 bankruptcy.
For the fourth quarter of 2022, Litecoin was the best performer returning 25.91%, while Solana was the worst at -70.86%. Bitcoin was down 17.40%.

Cryptocurrency lost a lot of ground in 2022. All of the major cryptocurrencies were down more than 50%. Litecoin was the best performer returning -54.10%, while Solana was the worst at -94.27%. Bitcoin was down 77.63%.

DISCLAIMER
SBC Investment Management’s Quarterly Market Summary and Outlook is intended to communicate current economic and capital market information along with the informed perspectives of our investment professionals. All expressions of opinion are subject to change. Past performance may not be indicative of future results. There is no assurance that any of the trends discussed will continue, or that any of the forecasts will occur.
You should not construe any information in this publication as investment, financial, or any other professional advice. Nothing contained in this publication constitutes a recommendation, endorsement, or an offer to buy or sell any securities or other financial instruments. You should conduct your own research or speak to your investment advisor before investing.
SBC Investment Management prepares this material as a resource for its clients. This content is for informational purposes only and does not address the circumstances of any particular individual or entity. You may contact us to discuss the content of this publication within the context of your own financial situation.