
Headwinds
Stock market performance in October 2023
Market Decline
The stock market experienced a significant decline in October 2023, marking the third consecutive monthly drop for major indices. The S&P 500 fell by 2.20% for the month, bringing its year-to-date return to 9.23%[1]. The Nasdaq declined by about 1.8% and the Dow Jones Industrial Average slipped 0.8%[2].
Correction Territory
The S&P 500 came close to entering correction territory, defined as a 10% drop from recent highs. By the end of October, the index was down about 8.3% from its July 31st peak[3].
Factors Contributing to the Decline
Rising bond yields, with the 10-year Treasury yield briefly surpassing 5% for the first time since 2007[4] [2].
Geopolitical tensions, particularly the conflict between Israel and Hamas [3].
Concerns over U.S. government funding and potential shutdowns[5].
Mixed corporate earnings reports [5].
Sector Performance
Technology stocks faced significant pressure, with the Nasdaq experiencing its worst two-day stretch since late 2022 [2]. Utilities stocks also struggled, losing 7% - their worst year since 2008 [4].
Economic Data
Despite the market decline, U.S. GDP growth was strong, expanding at an annualized rate of 4.9% in the third quarter [2].
Global Markets
International equity markets also declined, with the S&P Global BMI ex-U.S. falling 4.34% in October [6].
Market Volatility
October historically experiences 35% more volatility than the average of other months [7].
Recovery Signs
By early November, the S&P 500 had recovered by more than 5% from its lowest point in October, suggesting some stabilization [8].
Overall, October 2023 was a challenging month for the stock market, characterized by significant declines across major indices, driven by a combination of economic, geopolitical, and market-specific factors. However, strong economic growth and signs of recovery by early November provided some optimism for investors.
Bond market for October 2023
Rising Yields
The bond market experienced significant volatility and rising yields in October. The 10-year Treasury yield briefly surpassed 5% for the first time since 2007, reaching a peak of 5.02% in early trading [9] [11]. By the end of October, the 10-year yield settled at around 4.90%, up 33 basis points from the previous month[10] [2].
Factors Driving Yield Increases
Strong economic data, including robust GDP growth of 4.9% in Q3[11][9]
Persistent inflation concerns
Increased Treasury supply and rising term premiums
Geopolitical tensions, particularly in the Middle East[12][1]
Yield Curve
The yield curve experienced significant steepening, with longer-term yields rising more than shorter-term yields. The spread between 2-year and 10-year Treasury yields widened[13].
Bond Performance
Fixed income performance was largely negative in October due to rising yields. The Bloomberg U.S. Aggregate Bond Index lost 1.6% for the month[14][5].
Federal Reserve
The Fed kept interest rates unchanged at its October meeting, maintaining the target range at 5.25-5.50%. However, the Fed remained hawkish, indicating that rates could stay higher for longer [10][2].
Market Expectations
By the end of October, market participants were revising up their expectations for near-term growth and revising down the probability of a near-term recession [13].
Corporate Bonds
Investment grade corporate bond spreads widened by 9 basis points, closing October at an option-adjusted spread of 130 basis points [14][5].
Municipal Bonds
Municipal bond yields increased but outperformed Treasuries. Year-to-date municipal bond issuance was more than 8% lower than in 2022 [14] [5].
Global Impact
The rise in U.S. Treasury yields had a ripple effect on global bond markets, with yields rising in other developed countries as well.
Investor Sentiment
The volatile bond market led to increased uncertainty among investors, with many reassessing their fixed income strategies in light of the higher yield environment.
Overall, October 2023 was a challenging month for the bond market, characterized by rising yields, increased volatility, and negative returns for many fixed income investments. The market continued to grapple with strong economic data, inflation concerns, and uncertainty about the future path of monetary policy.
Commentary:
As we see final economic data coming in from the first and second quarter of 2023, signals and indicators show that we were more conservative than we should have been in the first 8 months of the year. Then September and October happened, and as mentioned above we're almost near correction territory on the stock market. As a reminder correction territory is 10% pullback or more. It is interesting the amount of press this is getting from Wall Street and other places, including government agencies. The pain for the average person is real. Inflation continues to steam ahead, while wage growth cannot keep pace, borrowing costs continue to increase on the back of higher treasury yields and the bond market continues to be a drag and, in some cases, it is more than the stock market, e.g. long term bond.

So what propped up the markets in the first and second quarter of 2023? Government spending accounted for a much higher proportion of the GDP in the previous three years. Our friends from Hedgeye have pointed out to us in the chart below, Government spending on defense and structure continue to be higher.

Headwinds, headwinds, headwinds, this is the theme of the next few months. Student loans start to be repaid, higher than consumer debt loans, was September or October the final spending spree. An excerpt from Real-Time Macro by analyst Christian Drake at Hedgeye on retail sales:
“Was September the grand spending finale? … A defiant last stand of sorts ahead of student loan repayment and the raft of impending Shock-tober headwinds?
• Headline = 0.7% M/M = accelerating +90bps to +3.8% Y/Y
• Control Group = +0.6% M/M = flat at +3.8% Y/Y
Summarily, Goods Consumption (both real & nominal) remained solid on balance to close out 3Q as the sloth-ian cycle claims another month.”

Conclusion:
With inflation still running the highest it's been in several decades, record high consumer debt, a near correction in the stock market, and the bond market approaching a bear market (20% decline in value) territory, we remain cautiously optimistic for the future. Historically markets recovered after rejection and bear markets. Where do we allocate capital in anticipation of this while still protecting the downside?
As noted in our model of 60 stock 40 bond target, we have been heavy in cash for long time. Cash yields or treasuries have been yielding around 5% for the last 9-12 months, making them a great risk-free option. The markets have continued to increase, despite all the variables that have been thrown its way. It reminds me of the 2005 - 2007 time. Stocks continued to increase during this period despite the underlying economy getting worse and worse and the risk in the market seemed to grow and grow. I recall being in undergrad studying the markets and scratching my head about what was going on. It did not make sense.
With that said, that is exactly why we diversify and protect against the downside. There were people in 2005 - 2007 that were calling out the risks in the markets, and no one believed them until it was too late. There will always be people out there there's going to be talking doomsday. Just like there will always be talking about how there is no limit to how high things can go. Eventually, both sides are going to be wrong.
All our portfolios are positioned to continue to protect against the downside, because we see a lot of risks in the market for further decline. Am I saying we are headed into another financial crisis? No. Am I saying that there is more headwinds and risks out there than what most Wall Street is telling you? Yes.
Model Performance Update
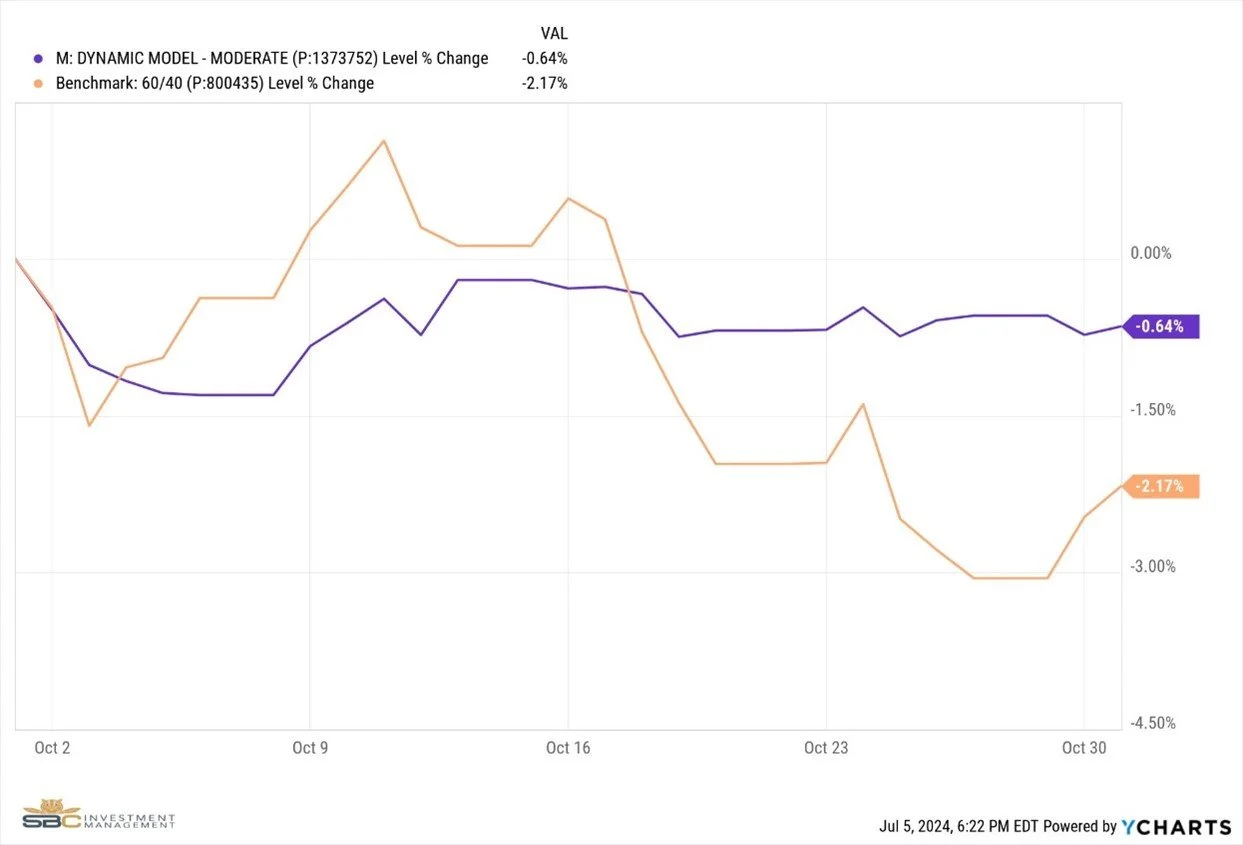
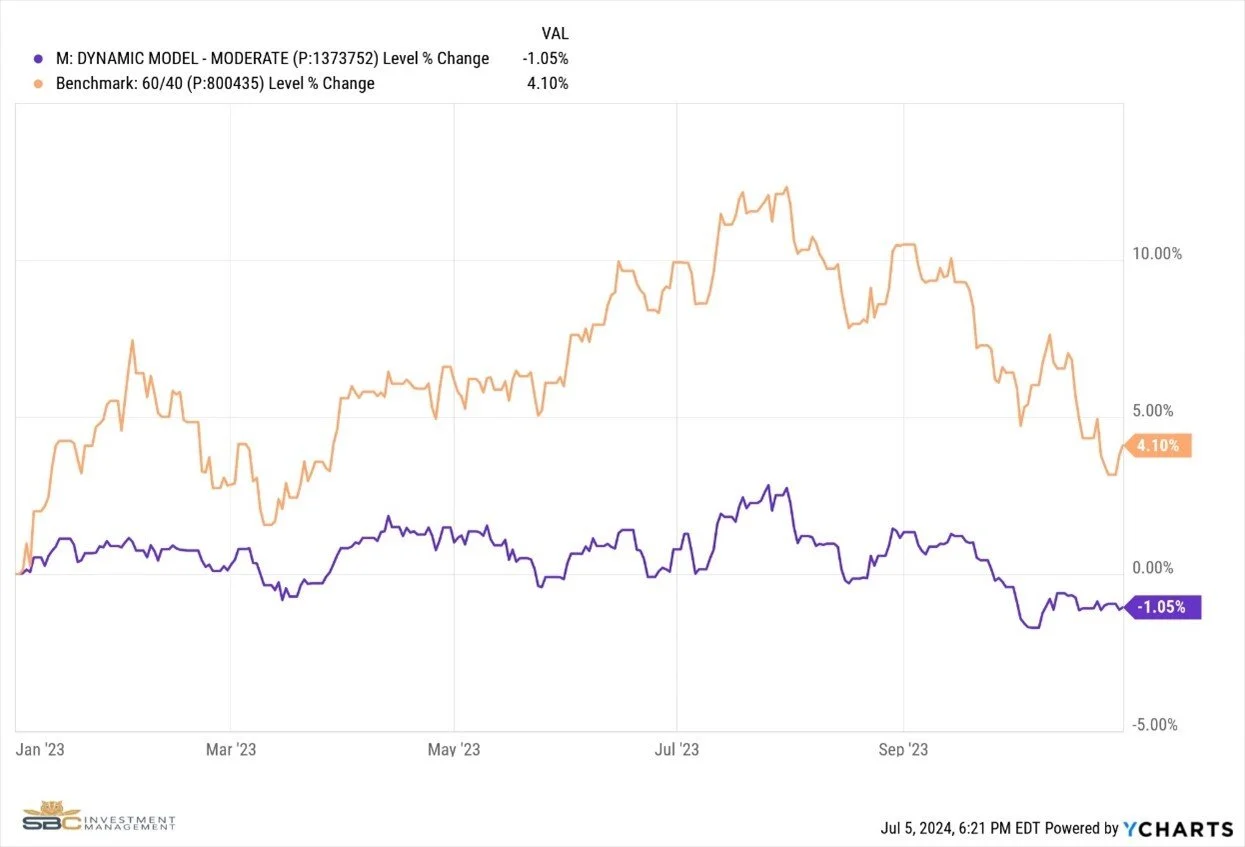
Our Moderate model portfolio returned -.64% during the Month of October and finished the month with -1.05% Year To Date (see charts below).
Hedgeye is now bearish on Japan. We are holding and expect signals to turn back up after a market correction. Japan is a longer-term investment.
Hedgeye has very few equity positions signaling a bullish trend. They believe we are most likely in a recession which won’t be called until midway through 2024. Hedgeye has managed futures (CTA), cash, and cash-equivalents in its top 5 holdings. Additional HE longs are energy (oil, gas, nuclear), insurance, gold, silver, USD, bitcoin, commodities. (Bitcoin and commodities are now bullish trend at Hedgeye.)
Changes to the Model Portfolio during the month of October
- No significant changes, we will begin to add commodities, energy (oil and nuclear), gold, silver and FMF (managed futures) in November barring any market disruptions.
October 2023 performance with benchmark
2024 Year to Date Performance with Benchmark
If you were to have any questions regarding the above, please reach out to us to set up a one-to-one meeting to review your situation.
Sincerely,
Bryant Andrus, MSF, CFP®
President
SBC Investment Management
P: (602) 641-5996
M: (319) 520-2033
E: bandrus@sbcinvestmentmanagement.com
DISCLAIMERS
SBC Investment Management’s Monthly and Quarterly Market Summary and Outlook is intended to communicate current economic and capital market information along with the informed perspectives of our investment professionals. All expressions of opinion are subject to change. Past performance may not be indicative of future results. There is no assurance that any of the trends discussed will continue, or that any of the forecasts will occur.
You should not construe any information in this publication as investment, financial, or any other professional advice. Nothing contained in this publication constitutes a recommendation, endorsement, or an offer to buy or sell any securities or other financial instruments. You should conduct your own research or speak to your investment advisor before investing.
SBC Investment Management prepares this material as a resource for its clients. This content is for informational purposes only and does not address the circumstances of any particular individual or entity. You may contact us to discuss the content of this publication within the context of your own financial situation.
Past performance may not be indicative of future results. Different types of investments involve varying degrees of risk. There can be no assurance that the future performance of any specific investment, investment strategy (including the investments and/or investment strategies recommended or undertaken by SBC Investment Management, LLC), or any non-investment related content, referred to directly or indirectly in this piece will be profitable, equal any corresponding indicated historical performance level(s), or prove successful. Due to various factors, including changing market conditions and/or applicable laws, the content may no longer be reflective of current opinions or positions. Moreover, you should not assume that any discussion or information contained in this piece serves as the receipt of, or as a substitute for, personalized investment advice from SBC Investment Management, LLC. Investment performance results published herein do not include investment advisory fees paid, or any other related account expenses. Performance results compiled solely by SBC Investment Management, LLC, have not been independently verified, and do not reflect the impact of taxes on non-qualified accounts.
Historical performance results for investment indices (provided for general comparison purposes only), strategies, models and/or indicators generally do not reflect the deduction of an investment management fee, nor the impact of taxes, the incurrence of which would have the effect of decreasing historical performance results. It should not be assumed that your account holdings correspond directly to any comparative indices.
Our past recommendations and model portfolio results are not a guarantee of future results. Using any graph, chart, formula, or other device to assist in deciding which securities to trade or when to trade them presents many difficulties and their effectiveness has significant limitations, including that prior patterns may not repeat themselves continuously or on any particular occasion. In addition, market participants using such devices can impact the market in a way that changes the effectiveness of such device.
Hypothetical performance results shown in this report and on sbcinvestmentmanagement.com are backtested and do not represent the performance of any account managed by SBC Investment Management, LLC. They were achieved by means of the retroactive application of each of the previously referenced models, certain aspects of which may have been designed with the benefit of hindsight.
The hypothetical backtested performance does not represent the results of actual trading using client assets nor decision-making during the period and does not and is not intended to indicate the past performance or future performance of any account or investment strategy managed by SBC Investment Management, LLC. If actual accounts had been managed throughout the period, ongoing research might have resulted in changes to the strategy, which might have altered returns. The performance of any account or investment strategy managed by SBC Investment Management, LLC will differ from the hypothetical backtested performance results for each factor shown herein for a number of reasons, including without limitation the following:
Although SBC Investment Management, LLC may consider from time to time one or more of the factors noted herein in managing any account, it may not consider all or any of such factors. SBC Investment Management, LLC may (and will) from time to time consider factors in addition to those noted herein in managing any account.
SBC Investment Management, LLC may rebalance an account more frequently or less frequently than annually and at times other than presented herein.
The hypothetical backtested performance results for each strategy include estimated values for transaction costs of buying and selling securities, which may not be accurate. Investment management fees, custody and other costs, and taxes – all of which would be incurred by an investor in any account managed by SBC Investment Management, LLC are not included in performance results. If such costs and fees were reflected, the hypothetical backtested performance results would be lower.
The hypothetical performance does not reflect the reinvestment of dividends and distributions therefrom, interest, capital gains and withholding taxes.
Accounts managed by SBC Investment Management, LLC are subject to additions and redemptions of assets under management, which may positively or negatively affect performance depending generally upon the timing of such events in relation to the market’s direction.
Simulated returns may be dependent on the market and economic conditions that existed during the period. Future market or economic conditions can adversely affect the returns.
SBC Investment Management, LLC is neither a law firm nor a certified public accounting firm. No portion of our website, our newsletter content, or any other correspondence from us should be construed as legal or accounting advice.
[1]https://www.spglobal.com/spdji/en/commentary/article/us-equities-market-attributes-october-2023/
[2] https://www.investopedia.com/dow-jones-today-10262023-8382845
[3] https://www.linkedin.com/pulse/october-2023-market-recap-winthropwealth-kct5e
[4] https://www.morningstar.com/markets/15-charts-surprise-everything-rally-2023
[5] https://www.confluencefp.com/monthly-market-recap-october-2023/
[6] https://www.wstam.com/news/market-updates/october-2023-global-equity-markets-review/
[7] https://www.sfgate.com/personal-finance/investing/article/stock-market-outlook-october-18402127.php
[8] https://youtu.be/ZMFlksiMBK0
[9] https://www.wsj.com/livecoverage/stock-market-today-dow-jones-10-23-2023
[10] https://www.wstam.com/news/market-updates/october-2023-fixed-income-markets-review/
[11] https://www.investopedia.com/dow-jones-today-10102023-8349390
[12] https://www.morningstar.com/funds/how-bond-funds-fared-2023
[13] https://home.treasury.gov/news/press-releases/jy1865
[14] https://www.breckinridge.com/insights/details/october-2023-market-commentary/